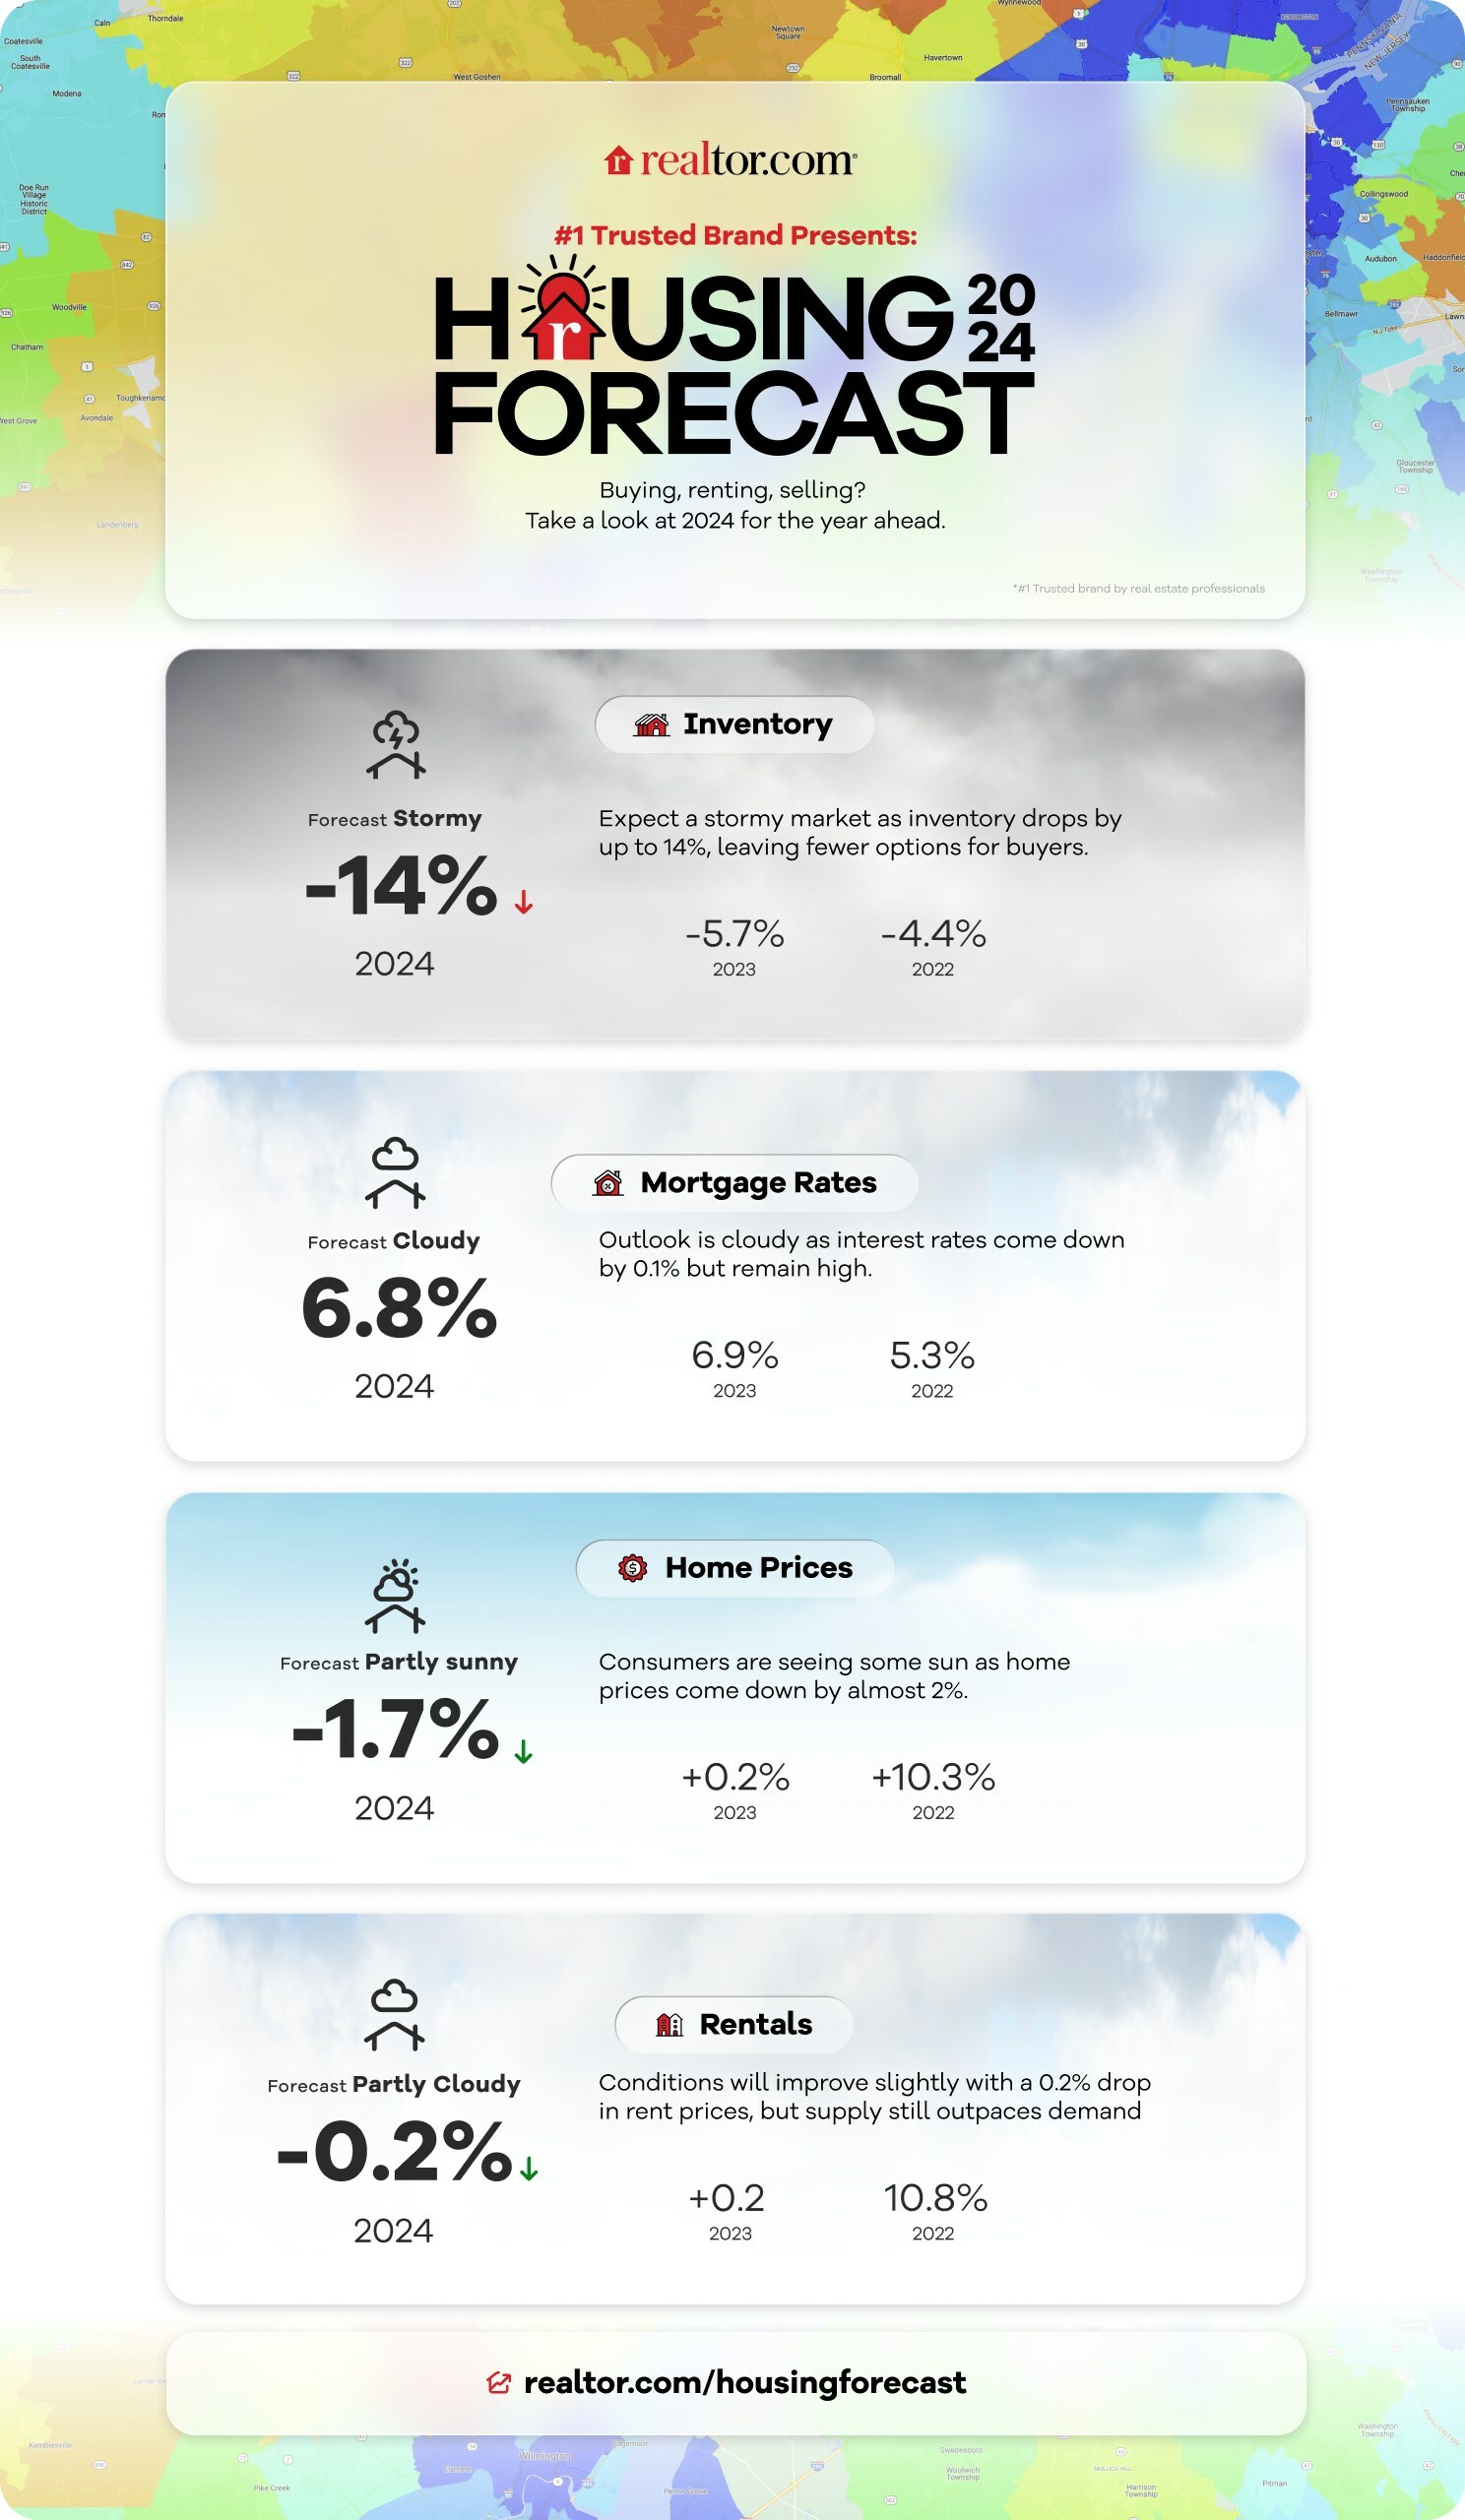
Buyers will finally see lower prices (-1.7%) and mortgage rates of 6.8% (on average), but may scramble to find inventory (-14%) as current owners happy with their low mortgage rates and pandemic home purchases stay put.
Lower mortgage rates and easing prices will help spark the beginning of an affordability turnaround in 2024, according to the Realtor.com® 2024 Housing Forecast released today. But the supply of existing homes will still be tight and renting will remain a competitive option in most markets. This year’s forecast also includes price and sales predictions for the top 100 U.S. metros (see table at bottom).

Overall in 2024, Realtor.com® forecasts that buyers and sellers can expect:
- Average mortgage rates of 6.8%, with rates edging down over the year to reach 6.5% by the end of the year.
- Home prices to ease slightly and drop by 1.7% after generally increasing since 2012.
- Rents to drop by 0.2%, making renting a more budget-friendly option than buying in most markets.
- A -14% year-over-year drop in inventory, as existing homeowners with low mortgage rates stay put.
- Home sales to hold steady, rising 0.1% year over year to 4.07 million.
“Our 2024 housing forecast reveals the green shoots we’ve been waiting to see in the housing market and should give buyers some optimism after a grueling few years. Although mortgage rates are expected to ease throughout the course of the year, the continuation of high costs will mean that existing homeowners will continue to have a high threshold for deciding to move, but we will start to see some interest,” said Danielle Hale, chief economist for Realtor.com®. “Moves of necessity – for job changes, family situation changes, and downsizing to a more affordable market – are likely to drive home sales in 2024. Home buyers will continue to seek out markets where they feel like they get the most out of their dollar as they look for homes that better meet their needs.”
Key 2023 housing trends and wildcards
- Affordability will officially turn around in 2024!! In 2024, the typical monthly purchase cost for the median priced home listing is expected to be slightly less than $2,200/month, or about 35% of the typical household income. That’s an improvement from 2023, when purchase costs ate up nearly 37% of income and the typical for-sale home cost $2,240. This tick up in affordability will give a foothold to some buyers trying to break into the market. Buyers planning to get into the market this year should use Realtor.com®‘s Buying Power tool which uses results from the affordability calculator to tag homes as “affordable,” “stretching,” or “difficult” based on typical lending criteria.
- Even more sellers hang back, but they could get motivated if rates drop faster than forecasted. Despite the fact that builders have been catching up, the lack of excess capacity in housing has been obvious over the last few years. With home sales activity forecasted to continue at a relatively low pace, the number of unsold homes on the market is also expected to remain low. But if rates drop faster than expected (which is possible given the roughly half point decline seen in November 2023), this could lessen rate lock sooner and bring more homes to the market than forecasted.
- Shiny new rental construction will hit the market. A once-hot rental market has slowed down, with the rental vacancy rate rising slightly, up to 6.6% in the third quarter of 2023, about where it was right before the pandemic. In 2024, an increase in new rentals will help push vacancy higher, closer to the 7.2% average seen from 2013-2019. While the surge in new rental options gives renters more to choose from, the sheer number of renters will minimize the potential price impact. The median asking rent in 2024 is expected to drop only slightly below its 2023 level (-0.2%).
- Sellers should be ready to compete with new construction. Home sales will likely be driven by moves of necessity in 2024. And even with the lower inventory of existing homes, sellers will be competing with new housing. Single-family home housing starts will increase an estimated 0.4% in 2024. Sellers will need to look at the new construction market in their area to make sure pricing and marketing are competitive.
- Geopolitics and inflation are among 2024’s wildcards: Even as markets adjusted to Russia’s war in Ukraine, conflict in the Middle East heated up to historic levels in the 4th quarter of 2023. Both wars have the potential to affect the global economy in ways that can’t be fully anticipated. On the domestic front, the 2024 election season, with its attendant uncertainty, will be in full swing. And while inflation is expected to continue to subside, anything that reverses that trend could raise long-term interest rates, and in turn nudge mortgage rates higher than expected. That might discourage potential sellers from making a move and could keep potential buyers on the sidelines, putting a damper on home sales.
“Buyers and sellers who are planning to get into the market this year should be prepared. Tools like Realtor.com®‘s RealCost™ rent vs. buy and affordability calculators can help buyers ensure they are making a sound financial decision based on current interest rates and their personal financial situation. Sellers can use the RealValue™ tools in Realtor.com®‘s My Home to understand what their proceeds from a sale could be, and plug this data into our mortgage payment calculator with current interest rates to understand exactly how much they would pay each month with a new home purchase. Additionally, everyone can see what our projections mean for home prices around the country by checking out the forecast layer in our RealView™ mapping tool,” Hale added.
Realtor.com®‘s RealView™ mapping tool now shows 2024 forecasted home price data by ZIP code right on the map. To view this information, simply start a search on Realtor.com® and select the map view to start filtering. Then, select the Forecast map layer to see predicted average home prices in your ZIP codes of interest. This feature is included for the top 100 largest U.S. metros and is available on the Realtor.com® Mweb and desktop.
For more information about the Realtor.com®‘s 2024 housing forecast, visit: realtor.com/housing-forecast-2024
Local Market Predictions – 100 Largest U.S. Metros (in alphabetical order)
Metro | 2024 Sales | 2024 Price |
Akron, Ohio | 3.2 % | 3.2 % |
Albany-Schenectady-Troy, N.Y. | 1.1 % | 3.7 % |
Albuquerque, N.M. | -4.1 % | 5.2 % |
Allentown-Bethlehem et al, Pa.-N.J. | 2.2 % | 5.0 % |
Atlanta-Sandy Springs et al, Ga. | -15.8 % | 0.4 % |
Augusta-Richmond County, Ga.-S.C. | 5.8 % | 1.8 % |
Austin-Round Rock, Texas | -11.7 % | -12.2 % |
Bakersfield, Calif. | 13.4 % | 2.3 % |
Baltimore-Columbia-Towson, Md. | -3.1 % | 4.6 % |
Baton Rouge, La. | -20.4 % | -5.6 % |
Birmingham-Hoover, Ala. | -4.9 % | -1.5 % |
Boise City, Idaho | -3.2 % | -3.4 % |
Boston-Cambridge-Newton, Ma.-N.H. | -0.6 % | -0.6 % |
Bridgeport-Stamford-Norwalk, Conn. | -1.3 % | 7.2 % |
Buffalo-Cheektowaga et al, N.Y. | 8.3 % | 3.9 % |
Cape Coral-Fort Myers, Fla. | -3.7 % | -2.9 % |
Charleston-North Charleston, S.C. | -13.2 % | 3.7 % |
Charlotte-Concord et al, N.C.-S.C. | -22.4 % | -0.9 % |
Chattanooga, Tenn.-Ga. | -3.6 % | 2.0 % |
Chicago et al, Ill.-Ind.-Wis. | -9.2 % | 1.1 % |
Cincinnati, Ohio-Ky.-Ind. | -3.9 % | 4.1 % |
Cleveland-Elyria, Ohio | -1.2 % | 2.8 % |
Colorado Springs, Colo. | -11.5 % | -1.7 % |
Columbia, S.C. | -12.3 % | -1.8 % |
Columbus, Ohio | -1.7 % | 2.2 % |
Dallas-Fort Worth-Arlington, Texas | -12.9 % | -8.4 % |
Dayton-Kettering, Ohio | -2.9 % | 4.8 % |
Deltona-Daytona Beach et al, Fla. | -3.7 % | -3.1 % |
Denver-Aurora-Lakewood, Colo. | -15.3 % | -5.1 % |
Des Moines-West Des Moines, Iowa | -5.6 % | 9.9 % |
Detroit-Warren-Dearborn, Mich. | -6.7 % | 10.9 % |
Durham-Chapel Hill, N.C. | -1.5 % | 5.8 % |
El Paso, Texas | 6.3 % | 4.6 % |
Fresno, Calif. | -6.0 % | -0.3 % |
Grand Rapids-Wyoming, Mich. | 6.1 % | 7.2 % |
Greensboro-High Point, N.C. | -1.2 % | 3.3 % |
Greenville-Anderson-Mauldin, S.C. | -12.4 % | 1.0 % |
Harrisburg-Carlisle, Pa. | 5.6 % | 5.1 % |
Hartford-West Hartford et al, Conn. | 3.1 % | 9.1 % |
Houston-The Woodlands et al, Texas | -9.7 % | -4.5 % |
Indianapolis-Carmel-Anderson, Ind. | -7.6 % | 6.1 % |
Jacksonville, Fla. | -5.8 % | -0.5 % |
Kansas City, Mo.-Kan. | 5.4 % | -1.2 % |
Knoxville, Tenn. | -5.9 % | 7.2 % |
Lakeland-Winter Haven, Fla. | 2.9 % | -3.5 % |
Lansing-East Lansing, Mich. | 1.2 % | 6.2 % |
Las Vegas-Henderson-Paradise, Nev. | 11.1 % | -2.3 % |
Little Rock et al, Ark. | 0.4 % | 3.1 % |
Los Angeles-Long Beach et al, Calif. | 9.2 % | 3.5 % |
Louisville et al, Ky.-Ind. | 9.1 % | 1.2 % |
Madison, Wis. | 3.9 % | -1.5 % |
McAllen-Edinburg-Mission, Texas | -0.6 % | 1.6 % |
Memphis, Tenn.-Ms.-Ark. | -10.8 % | -4.1 % |
Miami-Fort Lauderdale et al, Fla. | 3.8 % | 5.0 % |
Milwaukee-Waukesha et al, Wis. | 0.2 % | 1.1 % |
Minneapolis et al, Minn.-Wis. | -2.4 % | -0.9 % |
Nashville-Davidson et al, Tenn. | -11.4 % | -4.8 % |
New Haven-Milford, Conn. | 3.5 % | 3.5 % |
New Orleans-Metairie, La. | -1.1 % | 3.1 % |
New York-Newark et al, N.Y.-N.J.-Pa | -10.8 % | 3.0 % |
North Port-Sarasota et al, Fla. | 1.3 % | -4.9 % |
Ogden-Clearfield, Utah | -15.1 % | -3.8 % |
Oklahoma City, Okla. | 1.9 % | 1.6 % |
Omaha-Council Bluffs, Ne.-Iowa. | 1.1 % | 4.5 % |
Orlando-Kissimmee-Sanford, Fla. | 3.7 % | 2.2 % |
Oxnard-Thousand Oaks-Ventura, Calif. | 18.0 % | 3.3 % |
Palm Bay-Melbourne et al, Fla. | -6.1 % | 2.3 % |
Philadelphia et al, Pa.-N.J.-De.-Md. | -13.4 % | 3.8 % |
Phoenix-Mesa-Scottsdale, Ariz. | 4.4 % | -4.3 % |
Pittsburgh, Pa. | -8.5 % | 6.9 % |
Portland-South Portland, Me. | 8.0 % | -1.9 % |
Portland-Vancouver et al, Ore.-Wash | -25.6 % | -7.4 % |
Providence-Warwick, R.I-Ma | 3.9 % | 3.1 % |
Raleigh, N.C. | -17.0 % | 3.6 % |
Richmond, Va. | -11.6 % | 3.3 % |
Riverside et al, Calif. | 13.8 % | 2.0 % |
Rochester, N.Y. | 6.2 % | 10.4 % |
Sacramento–Roseville et al, Calif. | 10.3 % | -1.3 % |
Salt Lake City, Utah | -10.2 % | -4.1 % |
San Antonio-New Braunfels, Texas | -10.1 % | -9.4 % |
San Diego-Carlsbad, Calif. | 11.0 % | 5.4 % |
San Francisco-Oakland et al, Calif. | -0.8 % | -5.2 % |
San Jose-Sunnyvale et al, Calif. | -18.5 % | 3.1 % |
Scranton–Wilkes-Barre et al, Pa. | 5.5 % | 6.3 % |
Seattle-Tacoma-Bellevue, Wash. | 3.9 % | -1.0 % |
Spokane-Spokane Valley, Wash. | 3.6 % | -10.2 % |
Springfield, Mass. | 10.5 % | 4.2 % |
St. Louis, Mo.-Ill. | -2.3 % | -11.7 % |
Stockton-Lodi, Calif. | -5.8 % | -3.7 % |
Syracuse, N.Y. | 3.4 % | 6.4 % |
Tampa-St. Petersburg et al, Fla. | -5.3 % | 1.2 % |
Toledo, Ohio | 14.0 % | 8.3 % |
Tucson, Ariz. | 2.3 % | -1.8 % |
Tulsa, Okla. | -1.4 % | 2.8 % |
Urban Honolulu, Hawaii | -8.9 % | -1.9 % |
Virginia Beach et al, Va.-N.C. | 0.3 % | 5.3 % |
Washington et al, D.C.-Va.-Md.-W.V. | -0.8 % | 2.6 % |
Wichita, Kas. | -6.2 % | 2.3 % |
Winston-Salem, N.C. | -8.0 % | 0.3 % |
Worcester, Mass.-Conn. | 9.1 % | 4.8 % |
Methodology
Realtor.com®‘s model-based forecast uses data on the housing market and overall economy to estimate values for these variables in the year ahead.
About Realtor.com®
Realtor.com® is an open real estate marketplace built for everyone. Realtor.com® pioneered the world of digital real estate more than 25 years ago. Today, through its website and mobile apps, Realtor.com® is a trusted guide for consumers, empowering more people to find their way home by breaking down barriers, helping them make the right connections, and creating confidence through expert insights and guidance. For professionals, Realtor.com® is a trusted partner for business growth, offering consumer connections and branding solutions that help them succeed in today’s on-demand world. Realtor.com® is operated by News Corp [Nasdaq: NWS, NWSA] [ASX: NWS, NWSLV] subsidiary Move, Inc. For more information, visit Realtor.com®.
Media contact: press@realtor.com
SOURCE Realtor.com