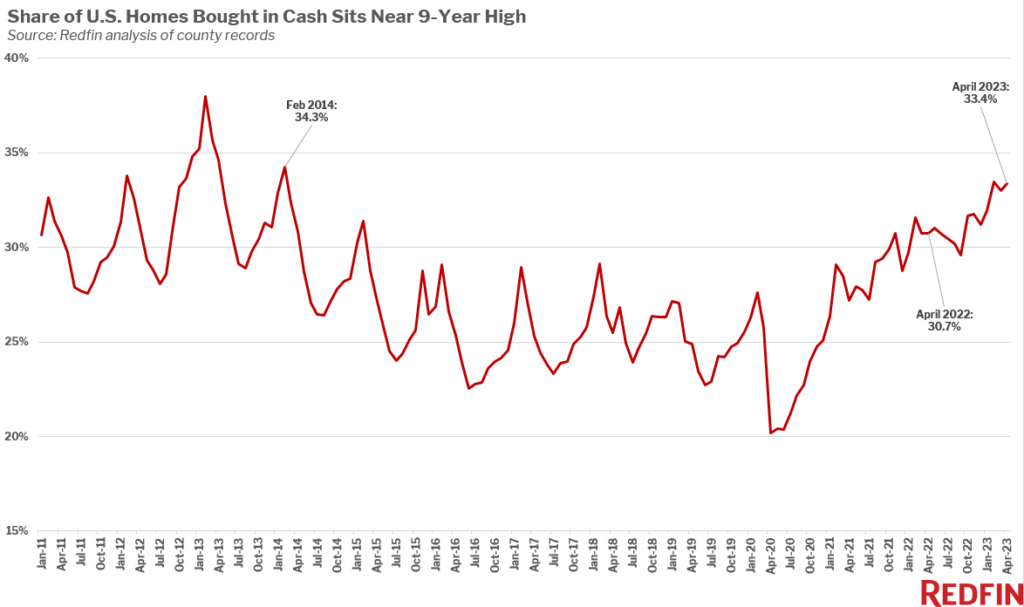
- All-cash home purchases reached their highest level since 2014 in April as high mortgage rates drove down overall home sales more than all-cash sales.
- The typical buyer’s down payment dropped 18% from a year earlier, ond of the biggest declines since the start of the pandemic.
- The share of buyers using FHA loans reached its highest level since before the pandemic, with sellers more apt to accept different loan types in a cool market. Jumbo loans, used for expensive home purchases, have become less prevalent.
One-third (33.4%) of U.S. home purchases were made in cash in April, up from 30.7% a year earlier and comparable with February’s 33.5% share, which was the highest in nine years.
The data in this report is from a Redfin analysis of county records across 40 of the most populous U.S. metropolitan areas, going back through 2011. April 2023 is the most recent month for which data is available. An all-cash purchase is one in which there is no mortgage loan information on the deed.
All-cash purchases are making up a bigger portion of the homebuying pie for one major reason: Elevated mortgage rates are deterring homebuyers who take out mortgages more than they’re deterring all-cash buyers. Overall home sales were down 41% from a year earlier in April in the metros included in this analysis, compared with a 35% decline for all-cash sales.
The average 30-year fixed mortgage rate was 6.79% at the start of June, near its highest level in 15 years. That has pushed monthly housing payments up to a record high and sidelined many would-be homebuyers, especially those who need to take out a mortgage.
But high rates can still be a deterrent for all-cash buyers because their money may be better spent on investments that benefit from high rates, like bonds. Inflation has pushed up interest rates over the last year, which has pushed up mortgage rates, rendering other investments more attractive in some cases.
“A homebuyer who can afford to pay in all cash is weighing two potential paths,” said Redfin Senior Economist Sheharyar Bokhari. “They can use cash to pay for the home and avoid high monthly interest payments, or take out a loan and pay a high mortgage rate. In that case, they could use the money that would have gone toward an all-cash purchase to invest in other assets that offer bigger returns, which could partly cancel out their high mortgage rate.”
“Buyers who can’t afford to pay in all cash also have two potential—but different—paths,” Bokhari continued. “They can avoid a high mortgage rate by dropping out of the housing market altogether, or they can take on a high rate. That discrepancy is the reason the all-cash share is near a decade high even though all-cash purchases have dropped: Affluent buyers have the choice to pay cash instead of dropping out of the market.”
Competition among homebuyers is a smaller but still noteworthy reason for the uptick in all-cash sales. A lack of homes for sale is prompting competition in some metro areas, motivating buyers to make all-cash offers to win homes. High mortgage rates are the main cause of today’s inventory shortage because they’re making homeowners stay put to hang onto their comparatively low rate. Even though high rates have pushed many buyers out of the market, they’ve pushed out even more would-be sellers; that means the buyers who are out there are often competing for the few homes on the market.
A surge in competition is the main factor in the jump in cash purchases during the pandemic homebuying boom in 2021–but at that time, low mortgage rates were causing bidding wars by attracting an influx of buyers.
See the table at the bottom of this report for metro-level data on all-cash purchases.
Down payments post one of the biggest drops since start of pandemic
The typical U.S. homebuyer’s down payment was $52,500 in April, down 18% from a year earlier. That’s the second-biggest drop since May 2020, when the housing market ground to a halt at the start of the pandemic (the biggest was a 22% drop in March 2023). Down payments have been falling on a year-over-year basis since November.
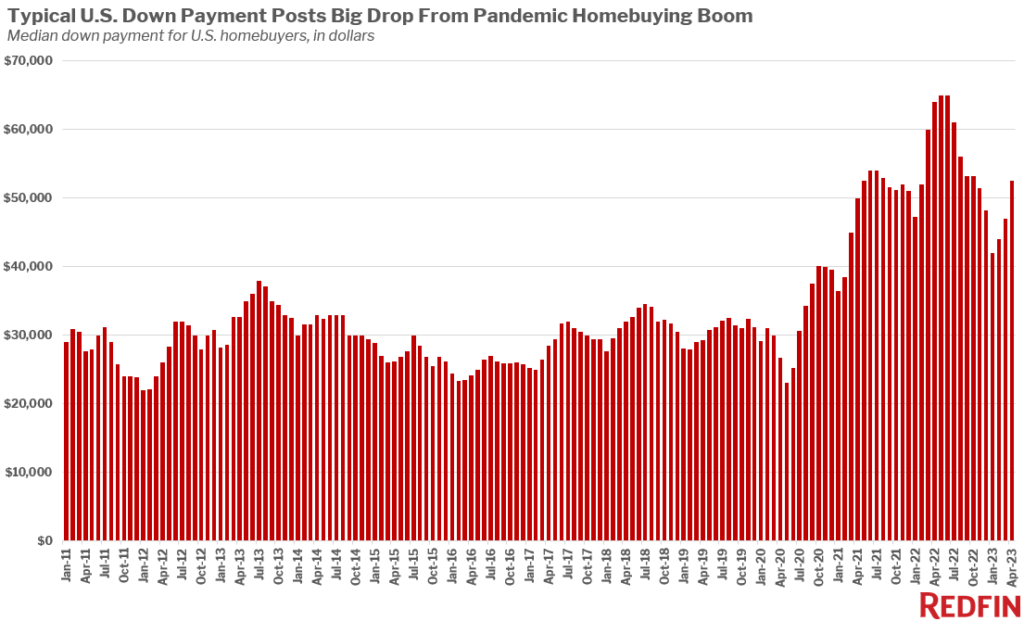
In percentage terms, the median down payment was equal to 13.1% of the purchase price, down from 16.5% a year earlier.
Down payments have fallen for several reasons: less competition among homebuyers, high mortgage rates and declining home prices.
Even though the inventory shortage is causing more competition for homes than one might expect given today’s relatively tepid demand, the bidding-war rate is much lower than it was a year ago. Forty-six percent of home offers written by Redfin agents faced competition in April, down from roughly 59% a year earlier. Less competition means fewer buyers need to offer a big down payment to prove their financial stability and stand out from the crowd. It also means FHA loans, which require lower down payments, are becoming more prevalent.
High mortgage rates and inflation mean a lot of buyers can’t afford to make big down payments. Maybe they’re using some of the money that would have been allocated toward a down payment for a mortgage-rate buydown or putting it in a savings account to help with high monthly payments.
The typical U.S. home sold for 4% less in April than a year earlier, and the drop is much bigger in some metro areas. Lower home prices mean lower dollar down payments; for instance, a 10% down payment on a $400,000 home equals $40,000, while a 10% down payment on a $350,000 home equals $35,000.
It’s worth noting that the big year-over-year decline is partly due to heights hit a year earlier; the median down payment reached $64,000 in April 2022, just shy of the following month’s $65,000 record.
Share of homebuyers using FHA loans hits highest share since before the pandemic as housing market cools
Roughly one in six (16.4%) U.S. mortgaged home sales used an FHA loan in April, the highest share since February 2020, just before the pandemic began. That’s up from 10.4% a year earlier; representing the largest year-over-year gain on record.
Just under 7% of mortgaged home sales used a VA loan, down from an eight-year high of 8% in February but up from 5.9% a year earlier.
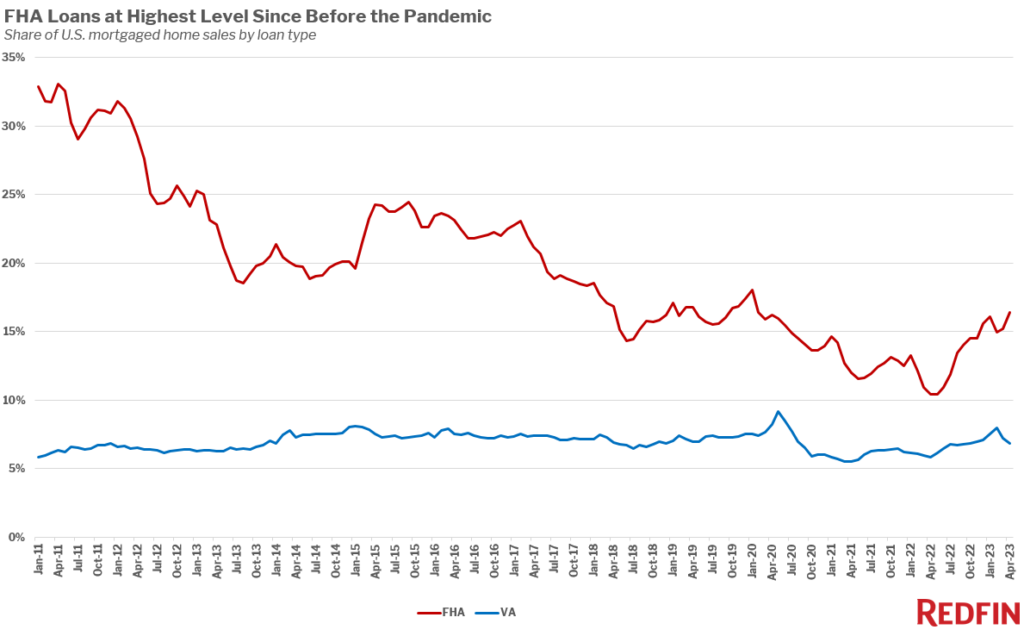
FHA and VA loans are both insured by the U.S. government. FHA loans, meant for low- to moderate-income borrowers and popular with first-time homebuyers, have lower down-payment and credit-score requirements than conventional loans. VA loans are available to veterans, service members and their surviving spouses and require little to no down payment.
Conventional loans are the most common type, making up more than three-quarters (76.8%) of mortgaged home sales. But the share of buyers using a conventional loan dropped from 83.7% from a year earlier, the biggest year-over-year decline on record.
FHA loans are becoming more common because high mortgage rates have cooled the housing market. FHA loans were rare during the pandemic homebuying frenzy because nearly every home received multiple offers; sellers would typically choose an all-cash offer or one using a conventional loan because they may believe they’re less likely to fall through. Now, buyers are more likely to get FHA loans accepted because sellers don’t have as many choices. There’s still plenty of competition for homes, especially in some parts of the country, but not nearly as much as there was during the buying boom of late 2020, 2021 and early 2022. Plus, even if a home is part of a bidding war, a buyer may be competing against fewer offers than they were a year ago; maybe there’s one other offer instead of 10.
Redfin agents in pandemic homebuying boomtowns Boise, ID, Austin, TX and Orlando, FL report that they saw an uptick in FHA loans in early spring. But Orlando Redfin Premier agent Nicole Dege said she’s noticed a decline in buyers using FHA loans since then.
“FHA and VA buyers finally felt like they could play the game and get their offers entertained in March and April,” Dege said. “Rates were high, but at least some of them could actually buy a home without being outbid. But now that inventory has declined more, buyers are fighting competition again and it’s tough to get an FHA offer accepted.”
High mortgage rates may also make buyers more likely to choose an FHA loan instead of a conventional loan, as FHA rates tend to be slightly lower; the average daily FHA rate was 6.54% on June 6, versus 6.89% for a conventional loan.
Even though FHA loans are becoming more common, the fact that one-third of home purchases are made in cash reflects the unequal nature of today’s housing market. Affluent buyers who can afford to pay for a home in cash still have an advantage because not only is it easier to get offers accepted, but they don’t have to take on high mortgage rates.
Jumbo loans have become less popular as rates stay elevated
Just 6.1% of mortgaged home sales used a jumbo loan in April, down from 10.6% a year earlier but up from the decade-low of 4.3% hit in January.
A jumbo loan is a type of conventional loan, in which the loan amount exceeds the limit set by the federal government (FHFA). In most U.S. states, they’re used for homebuyers who borrow more than $726,200, though the limit is higher in certain expensive states.
Jumbo loans have become less common over the last year as mortgage rates have risen. Elevated rates have pushed some buyers of expensive homes out of the market entirely, and pushed some into lower price ranges. Banks are also more hesitant to take potential losses on jumbo loans in the aftermath of this year’s bank failures.
Metro-level highlights
This section is based on Redfin’s analysis of 40 of the most populous U.S. metropolitan areas.
- All cash. All-cash purchases were most common in Cleveland, OH in April. Next came West Palm Beach, FL and Baltimore. They were least common in San Jose, CA, Seattle and Oakland, CA, all expensive West Coast metros
- All cash, YoY. All-cash purchases increased in April from a year earlier in 27 of the metros Redfin analyzed. They increased most in Cleveland, Baltimore and Riverside, CA, and declined most in Las Vegas, Atlanta and Milwaukee.
- Down payments. Down payments and down payment percentages were highest in San Francisco, San Jose and Anaheim, CA, and lowest in Virginia Beach, VA, Detroit and Pittsburgh.
- Down payments, YoY. Down payment dollar amounts dropped in 33 of the metros Redfin analyzed, with the biggest drops in Las Vegas, Phoenix and Riverside, CA. The biggest increases were in Newark, NJ, Milwaukee and Montgomery County, PA. Down payment percentages dropped in 19 metros, rose in two and stayed the same in the others. Percentages dropped most in Las Vegas, Providence, RI and Phoenix, and rose in San Jose and San Francisco.
- FHA loans. FHA loans were most common in Riverside, Providence, RI and Las Vegas. They were least common in San Jose, San Francisco and Anaheim, CA.
- FHA loans, YoY. The use of FHA loans increased in all but one metro Redfin analyzed. It rose most in Riverside, Las Vegas and Phoenix, and declined in New York.
- VA loans. VA loans were most common in Virginia Beach, VA, San Diego and Washington, D.C., all of which have a major military presence. They were least common in San Francisco, New York and San Jose.
- VA loans, YoY. VA loan usage increased in 33 of the metros Redfin analyzed. It rose most in Denver, Tampa, FL and Las Vegas, and declined most in Baltimore, Pittsburgh and New York.
- Jumbo loans. Jumbo loans are most common in the Bay Area: San Jose, San Francisco and Oakland are the top three.They’re least common in relatively affordable metros: Warren, MI, Pittsburgh and Cleveland.
- Jumbo loans, YoY. Use of jumbo loans declined in 37 of the metros Redfin analyzed, with the biggest drops in San Francisco, Seattle and Oakland. Usage increased in New Brunswick, NJ and Virginia Beach and was unchanged in Detroit.
| Metro-Level Summary: Home Sales by Loan Type, April 2023 Share of mortgaged home sales using each common loan type Share of home sales using all cash | ||||||||
| U.S. metro area | Share of home sales using all cash | Share of home sales using all cash, YoY (in percentage points) | Share of mortgaged home sales using FHA loan | Share of mortgaged home sales using FHA loan, YoY (in percentage points) | Share of mortgaged home sales using VA loan | Share of mortgaged home sales using VA loan, YoY (in percentage points) | Share of mortgaged home sales using jumbo loan | Share of mortgaged home sales using jumbo loan, YoY (in percentage points) |
| Anaheim, CA | 28.8% | 4.8 ppts. | 4.2% | 2.8 ppts. | 2.0% | -0.3 ppts. | 15.6% | -11.8 ppts. |
| Atlanta, GA | 37.6% | -7.5 ppts. | 21.8% | 9 ppts. | 6.6% | 1.1 ppts. | 2.7% | -2.3 ppts. |
| Baltimore, MD | 52.9% | 22.9 ppts. | 20.2% | 2.8 ppts. | 7.8% | -2.1 ppts. | 2.4% | -1.9 ppts. |
| Charlotte, NC | 36.9% | -1.1 ppts. | 15.5% | 6.1 ppts. | 6.3% | 1.7 ppts. | 5.1% | -0.5 ppts. |
| Chicago, IL | 24.4% | 3.3 ppts. | 17.1% | 2 ppts. | 3.3% | 0.6 ppts. | 3.6% | -3.1 ppts. |
| Cincinnati, OH | 46.4% | 14.4 ppts. | 15.5% | 1.8 ppts. | 6.0% | 1.5 ppts. | 1.0% | -0.7 ppts. |
| Cleveland, OH | 65.7% | 31 ppts. | 19.9% | 1.5 ppts. | 5.4% | 1.4 ppts. | 0.6% | -0.2 ppts. |
| Columbus, OH | 30.3% | -0.3 ppts. | 13.2% | 2.7 ppts. | 5.6% | 0.5 ppts. | 1.7% | -0.2 ppts. |
| Denver, CO | 30.4% | 5.8 ppts. | 14.6% | 8 ppts. | 7.0% | 3 ppts. | 6.6% | -6.9 ppts. |
| Detroit, MI | 41.7% | 5.3 ppts. | 23.4% | 0.5 ppts. | 4.5% | 1.5 ppts. | 0.7% | 0 ppts. |
| Fort Lauderdale, FL | 42.3% | -3 ppts. | 17.2% | 5.9 ppts. | 4.3% | 0.8 ppts. | 5.8% | -2.7 ppts. |
| Jacksonville, FL | 52.2% | 3.3 ppts. | 18.1% | 7.8 ppts. | 14.3% | 0.1 ppts. | 4.4% | -0.3 ppts. |
| Las Vegas, NV | 26.5% | -11.9 ppts. | 26.3% | 13.9 ppts. | 12.1% | 2.2 ppts. | 2.4% | -2.7 ppts. |
| Los Angeles, CA | 21.2% | 1.9 ppts. | 15.3% | 6.8 ppts. | 2.5% | 0.2 ppts. | 12.1% | -10.1 ppts. |
| Miami, FL | 40.9% | 0.9 ppts. | 17.8% | 7.9 ppts. | 2.2% | 0.9 ppts. | 10.9% | -3 ppts. |
| Milwaukee, WI | 25.0% | -7.5 ppts. | 12.1% | 0.6 ppts. | 3.4% | 0.5 ppts. | 1.3% | -1.3 ppts. |
| Minneapolis, MN | 28.5% | 4 ppts. | 9.1% | 2.9 ppts. | 4.0% | 0.7 ppts. | 2.5% | -1.6 ppts. |
| Montgomery County, PA | 38.7% | 11.7 ppts. | 9.7% | 2.6 ppts. | 3.0% | 1 ppts. | 4.3% | -1.4 ppts. |
| Nashville, TN | 36.6% | -1.8 ppts. | 18.0% | 9.2 ppts. | 6.2% | 1.4 ppts. | 4.2% | -2.7 ppts. |
| New Brunswick, NJ | 37.2% | 8.2 ppts. | 11.9% | 1.6 ppts. | 2.4% | 0.3 ppts. | 2.8% | 0.5 ppts. |
| New York, NY | 35.2% | 10.1 ppts. | 10.9% | -0.5 ppts. | 1.0% | -0.6 ppts. | 8.9% | -4.1 ppts. |
| Newark, NJ | 27.8% | 4.8 ppts. | 19.5% | 0.1 ppts. | 2.0% | -0.4 ppts. | 3.3% | -1.8 ppts. |
| Oakland, CA | 18.6% | 4.9 ppts. | 5.6% | 1.3 ppts. | 2.1% | 0.7 ppts. | 20.3% | -15.1 ppts. |
| Orlando, FL | 35.1% | -4.4 ppts. | 21% | 10.2 ppts. | 6.3% | 0.5 ppts. | 2.8% | -2 ppts. |
| Philadelphia, PA | 40.9% | 11.5 ppts. | 19.3% | 4.3 ppts. | 2.5% | 0.7 ppts. | 2.8% | -0.9 ppts. |
| Phoenix, AZ | 29.0% | -7.3 ppts. | 21.7% | 12.6 ppts. | 7.8% | 1.3 ppts. | 4.2% | -4.6 ppts. |
| Pittsburgh, PA | 34.3% | 8.3 ppts. | 14.9% | 4 ppts. | 4.7% | -0.7 ppts. | 0.6% | -1.7 ppts. |
| Portland, OR | 29.0% | 9.8 ppts. | 14.9% | 8.6 ppts. | 5.3% | 0.6 ppts. | 4.5% | -4.5 ppts. |
| Providence, RI | 20.1% | -3.9 ppts. | 29.4% | 12.5 ppts. | 5.4% | 1.1 ppts. | 3.1% | -2.6 ppts. |
| Riverside, CA | 40.4% | 16.6 ppts. | 30.7% | 14 ppts. | 7.8% | -0.1 ppts. | 3.1% | -5.5 ppts. |
| Sacramento, CA | 21.2% | -0.5 ppts. | 13.4% | 5.4 ppts. | 5.1% | 0.5 ppts. | 4.8% | -4.8 ppts. |
| San Diego, CA | 21.6% | 1.7 ppts. | 9.9% | 5.7 ppts. | 15.0% | 1.1 ppts. | 12.5% | -8.5 ppts. |
| San Francisco, CA | 24.5% | 5.7 ppts. | 1.8% | 1.7 ppts. | 0.4% | -0.3 ppts. | 39.0% | -25.5 ppts. |
| San Jose, CA | 17.9% | 4.7 ppts. | 1.6% | 0.5 ppts. | 1.3% | 0.5 ppts. | 45.6% | -14.7 ppts. |
| Seattle, WA | 18.6% | 2.6 ppts. | 6.3% | 3.7 ppts. | 2.8% | 0.7 ppts. | 13.4% | -15.2 ppts. |
| Tampa, FL | 37.7% | -5.8 ppts. | 20.7% | 10.3 ppts. | 10.3% | 2.9 ppts. | 2.8% | -1.4 ppts. |
| Virginia Beach, VA | 23.3% | 3.1 ppts. | 15.7% | 1.5 ppts. | 40.1% | 1.5 ppts. | 1.8% | 0.1 ppts. |
| Warren, MI | 35.0% | 5.9 ppts. | 16.5% | 4.3 ppts. | 4.9% | 0.5 ppts. | 0.4% | -1.4 ppts. |
| Washington, DC | 24.7% | 5.9 ppts. | 13.8% | 3.6 ppts. | 14.4% | 0.4 ppts. | 3.7% | -1.2 ppts. |
| West Palm Beach, FL | 53.6% | -5.5 ppts. | 14.5% | 6.2 ppts. | 3.4% | 1.1 ppts. | 8.8% | -3.8 ppts. |
| Metro-Level Summary: Down Payments, April 2023 Median down payments, in dollars and percentages | ||||
| U.S. metro area | Median down payment (dollars) | Median down payment (dollars), YoY | Median down payment (percentage) | Median down payment (percentage), YoY (in percentage points) |
| Anaheim, CA | $227,500 | -11.7% | 20.0% | -1.7 ppts. |
| Atlanta, GA | $29,000 | -27.0% | 7.5% | -2.5 ppts. |
| Baltimore, MD | $20,000 | -9.7% | 5.0% | 0 ppts. |
| Charlotte, NC | $37,275 | -19.7% | 10% | -1.5 ppts. |
| Chicago, IL | $32,695 | -0.9% | 10% | 0 ppts. |
| Cincinnati, OH | $18,500 | -26.0% | 6.6% | -3.4 ppts. |
| Cleveland, OH | $19,250 | 1.3% | 10% | 0 ppts. |
| Columbus, OH | $24,035 | -27.1% | 8.3% | -2.4 ppts. |
| Denver, CO | $73,295 | -25.4% | 14% | -3.7 ppts. |
| Detroit, MI | $9,600 | -40.3% | 5% | -2.5 ppts. |
| Fort Lauderdale, FL | $54,500 | -9.2% | 20% | 0 ppts. |
| Jacksonville, FL | $28,778 | -20.1% | 9.5% | -0.5 ppts. |
| Las Vegas, NV | $27,800 | -49.8% | 6.4% | -7.9 ppts. |
| Los Angeles, CA | $150,212 | -17.5% | 20% | 0 ppts. |
| Miami, FL | $70,500 | -10.2% | 20% | 0 ppts. |
| Milwaukee, WI | $28,000 | 17.9% | 10% | 0 ppts. |
| Minneapolis, MN | $34,188 | -9.7% | 10% | 0 ppts. |
| Montgomery County, PA | $66,000 | 10.0% | 20% | 0 ppts. |
| Nashville, TN | $39,000 | -35.0% | 10% | -5 ppts. |
| New Brunswick, NJ | $80,000 | 3.2% | 20% | 0 ppts. |
| New York, NY | $157,250 | 6.9% | 20% | 0 ppts. |
| Newark, NJ | $67,000 | 20.6% | 15% | 0 ppts. |
| Oakland, CA | $210,000 | -12.5% | 20% | 0 ppts. |
| Orlando, FL | $41,675 | -27.2% | 10% | -6.1 ppts. |
| Philadelphia, PA | $22,250 | -23.3% | 8.3% | -1.7 ppts. |
| Phoenix, AZ | $40,000 | -46.1% | 10% | -6.9 ppts. |
| Pittsburgh, PA | $15,000 | -4.8% | 5% | 0 ppts. |
| Portland, OR | $73,800 | -18% | 15% | -5 ppts. |
| Providence, RI | $26,900 | -40.2% | 7.1% | -6.9 ppts. |
| Riverside, CA | $44,663 | -44.2% | 10% | -6.2 ppts. |
| Sacramento, CA | $90,900 | -17.4% | 20% | 0 ppts. |
| San Diego, CA | $141,538 | -13.2% | 20% | 0 ppts. |
| San Francisco, CA | $370,563 | -7.8% | 25% | 0.1 ppts. |
| San Jose, CA | $360,000 | -5.0% | 23.5% | 1.9 ppts. |
| Seattle, WA | $141,000 | -19.7% | 20% | 0 ppts. |
| Tampa, FL | $34,512 | -29.6% | 10% | -4.5 ppts. |
| Virginia Beach, VA | $6,887 | -23.6% | 2.1% | -0.9 ppts. |
| Warren, MI | $20,500 | -19.8% | 8.0% | -2 ppts. |
| Washington, DC | $52,500 | 2.9% | 10% | 0 ppts. |
| West Palm Beach, FL | $75,000 | -6.3% | 20% | 0 ppts. |