Redfin’s Homebuyer Demand Index, which measures requests for tours and other buying services from our agents, jumped as prices fell for the sixth-straight week and mortgage rates declined for the third week in a row. But a lack of new listings is holding back sales.
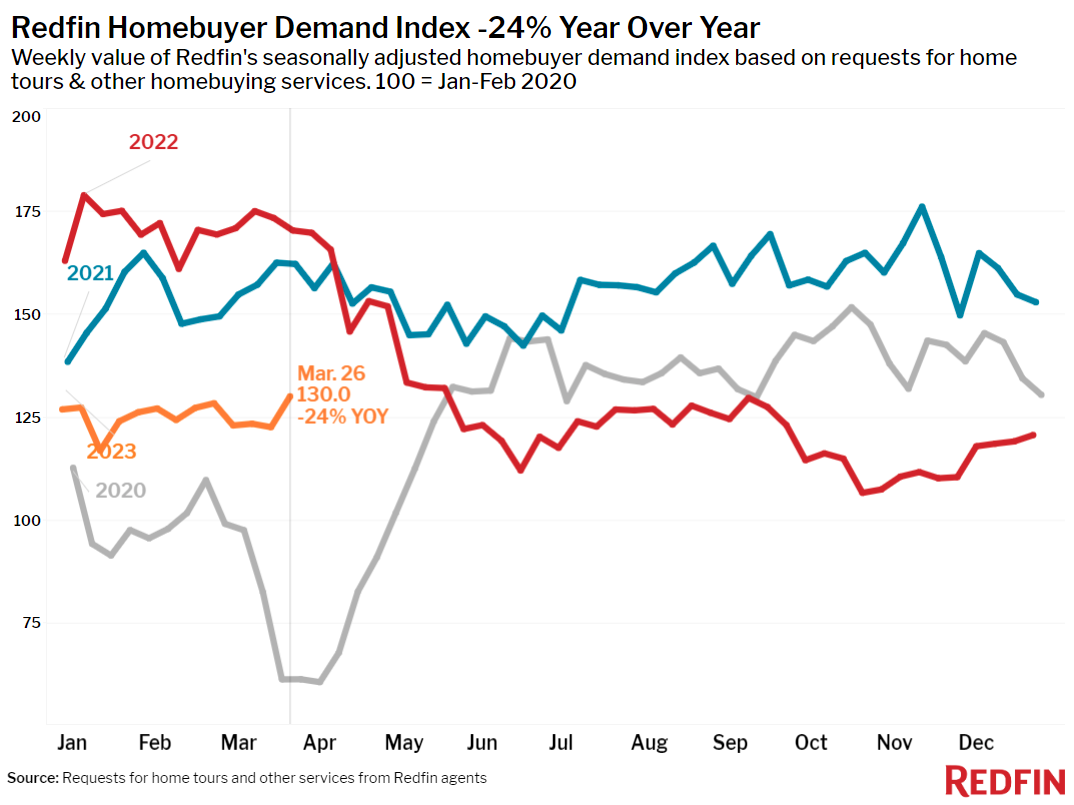
House hunters are wading into the market as mortgage rates and home prices continue to decline. Mortgage-purchase applications increased for the fourth week in a row and Redfin’s Homebuyer Demand Index–a seasonally adjusted measure of requests to tour homes, make an offer on a home and/or start a home search with a Redfin agent–jumped to its highest level since last May during the week ending March 26.
“My phone is ringing, and it’s usually first-time buyers or investors,” said San Francisco Redfin agent Ali Mafi. “First-time buyers are interested in looking at homes because prices have come down, though they’re still concerned about high mortgage rates. Investors who can pay in cash are honing in on luxury San Francisco condos because prices on those have dropped even more significantly than the overall market.”
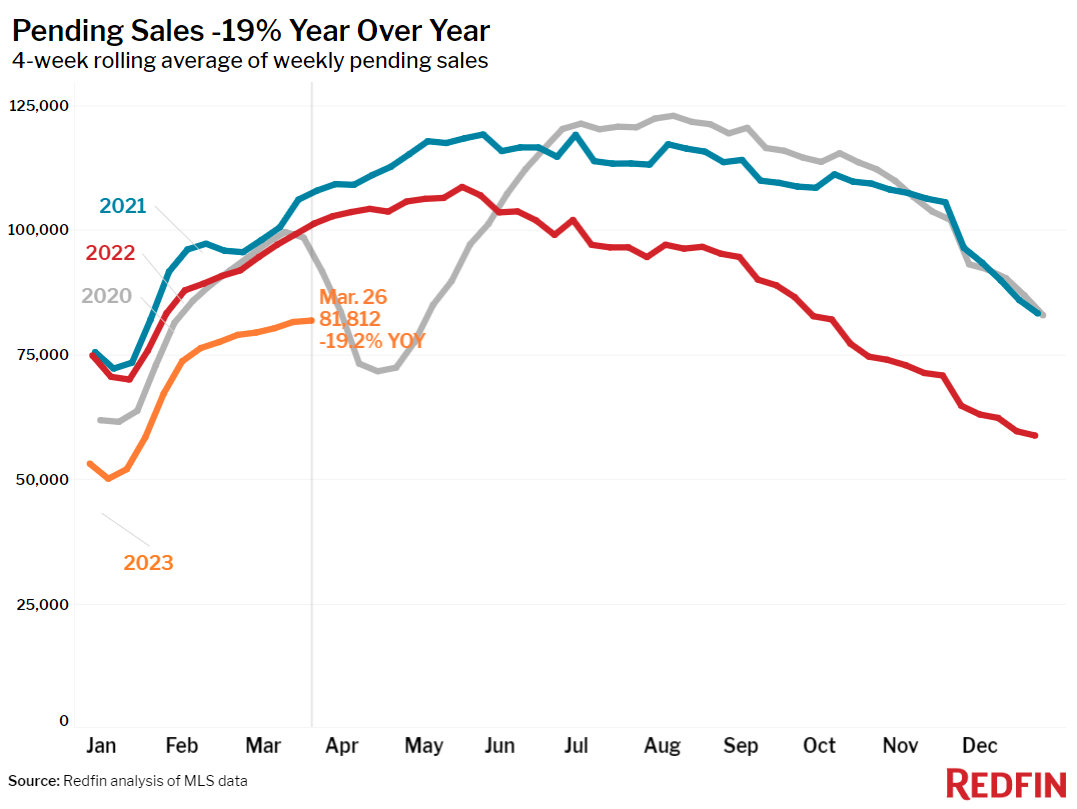
The uptick in early-stage demand has yet to translate into more home sales. Pending sales dropped 19% year over year nationwide in the four weeks ending March 26, the biggest decline in about two months. Demand for homes hasn’t yet translated into an improvement in sales mainly because would-be buyers are limited by lack of supply.
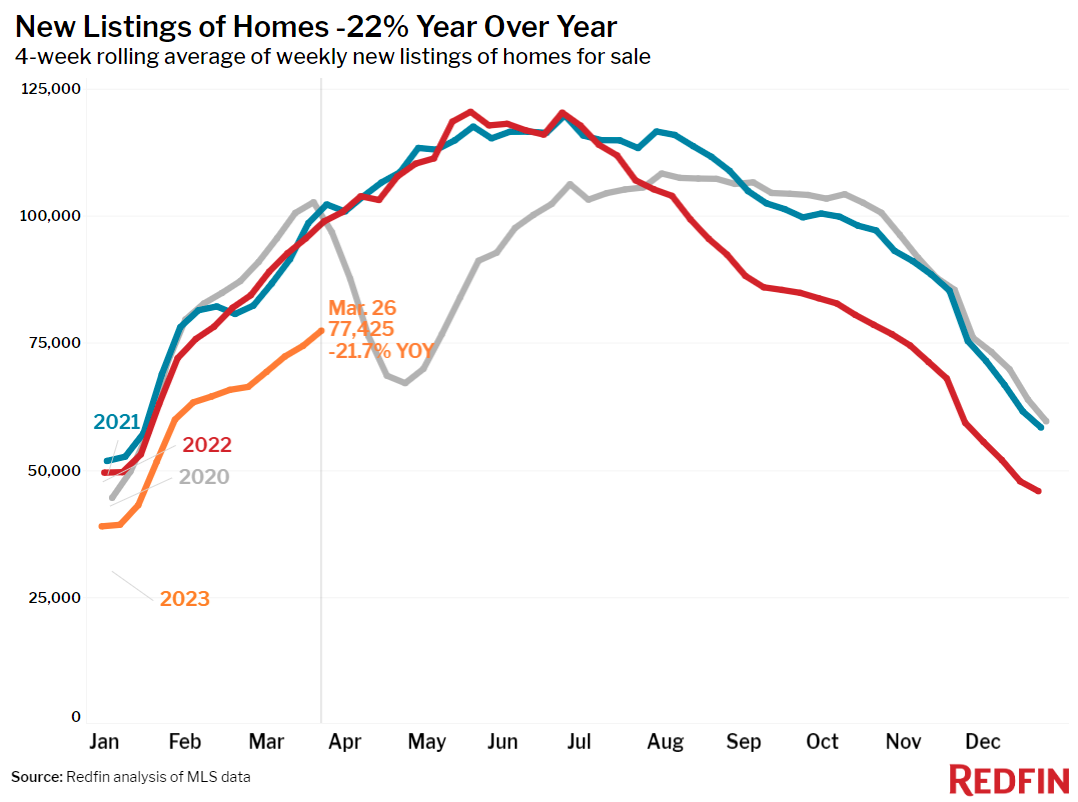
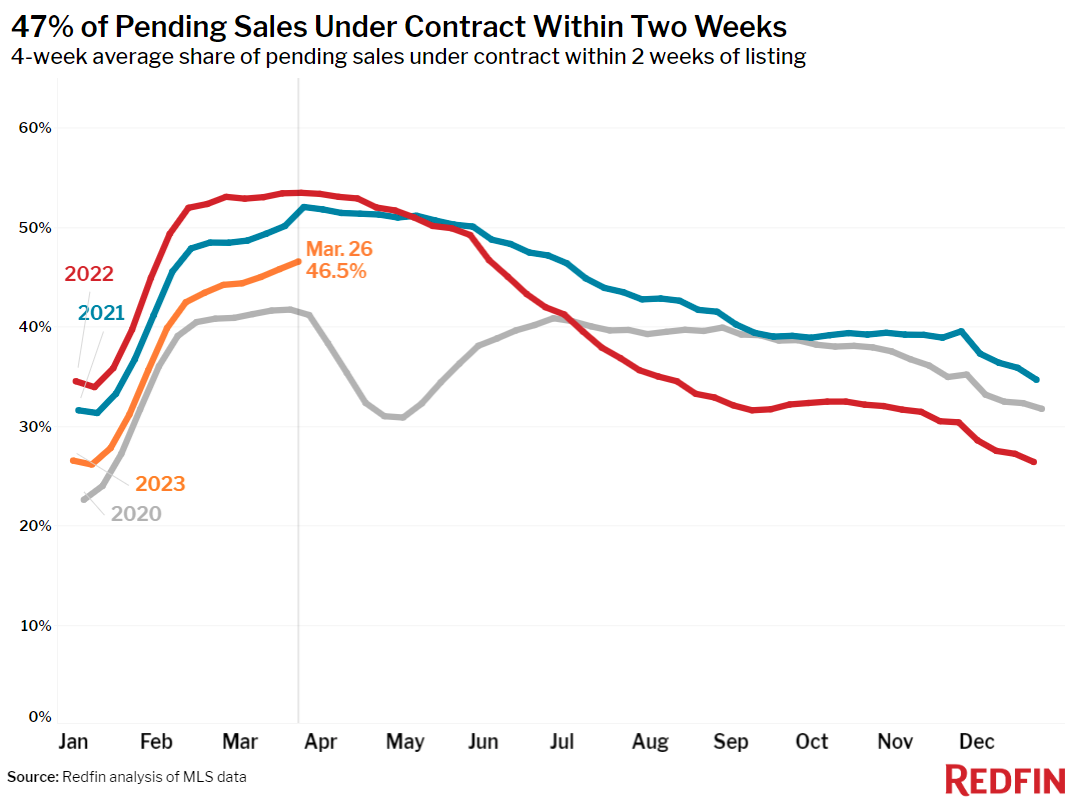
New listings of homes for sale declined 22%, one of the biggest drops since the start of the pandemic; homeowners are reluctant to sell because they don’t want to give up a low mortgage rate. The lack of new listings is causing a growing share of homes to fly off the market quickly: Nearly half of homes are selling within two weeks, the largest share since June.
Home prices drop in over half of the country, but rise in some areas
While the scarcity of new listings is holding back sales nearly everywhere in the U.S., prices are dropping fast in some parts of the country and increasing in others.
Home prices dropped in more than half (28) of the 50 most populous U.S. metros, with the biggest drop in Austin, TX (-15.2% YoY). Next come four northern California metros: San Jose, CA (-12.9%), San Francisco (-11.7%), Sacramento, CA (-11.4%), and Oakland, CA (-10.8%). Those are the biggest annual declines since at least 2015 for Austin and Sacramento.
On the flip side, sale prices increased most in Milwaukee, where they rose 14.1% year over year. Next come Fort Lauderdale, FL (8.5% YoY), Virginia Beach, VA (6.9%), West Palm Beach, FL (6.7%) and Providence, RI (6.4%).
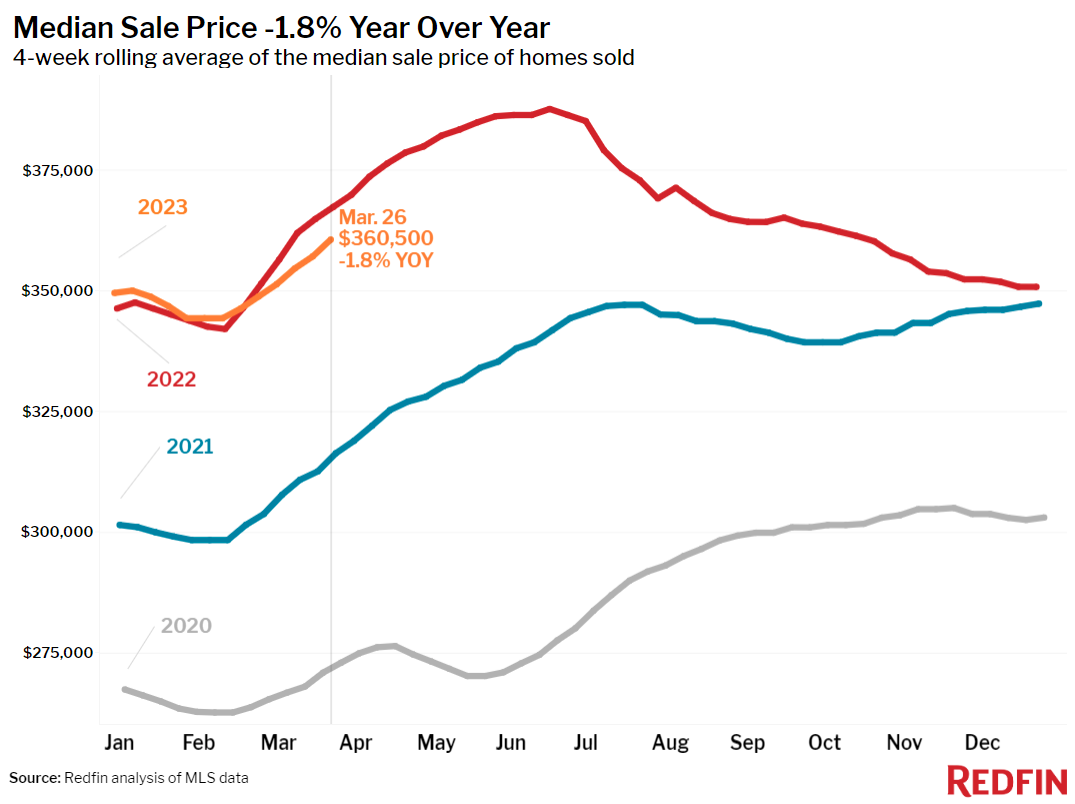
On a national level, the median U.S. home-sale price fell 1.8% year over year to $360,500, marking the sixth straight week of declines after more than a decade of increases.
“Prices are still rising quickly in some places while they are down by double digits in big tech hubs, so it’s important for prospective buyers to work with an expert local agent,” said Redfin Deputy Chief Economist Taylor Marr. “One thing that’s true almost everywhere: It’s difficult to find a desirable, well-priced home for sale, so offer and negotiation strategies differ depending on where you’re looking.”
Leading indicators of homebuying activity:
- For the week ending March 30, average 30-year fixed mortgage rates dropped to 6.32%, the third straight week of declines. The daily average was 6.59% on March 30.
- Mortgage-purchase applications during the week ending March 24 increased 2% from a week earlier, seasonally adjusted, marking the fourth straight week of increases. Purchase applications were up 19% from a month earlier, but down 35% from a year earlier.
- The seasonally adjusted Redfin Homebuyer Demand Index–a measure of request for home tours and other homebuying services from Redfin agents–jumped to its highest level since May during the week ending March 26. It was up 6% from a week earlier, but down 24% from a year earlier.
- Google searches for “homes for sale” were up about 44% from the trough they hit in December during the week ending March 25, but down about 17% from a year earlier.
- Touring activity as of March 26 was up about 20% from the start of the year, compared with a 24% increase at the same time last year, according to home tour technology company ShowingTime.
Key housing market takeaways for 400+ U.S. metro areas:
Unless otherwise noted, the data in this report covers the four-week period ending March 26. Redfin’s weekly housing market data goes back through 2015.
Data based on homes listed and/or sold during the period:
- The median home sale price was $360,500, down 1.8% from a year earlier. That’s the sixth week in a row of prices declining annually after more than a decade of increases. The latter is according to Redfin’s monthly dataset, which goes back through 2012.
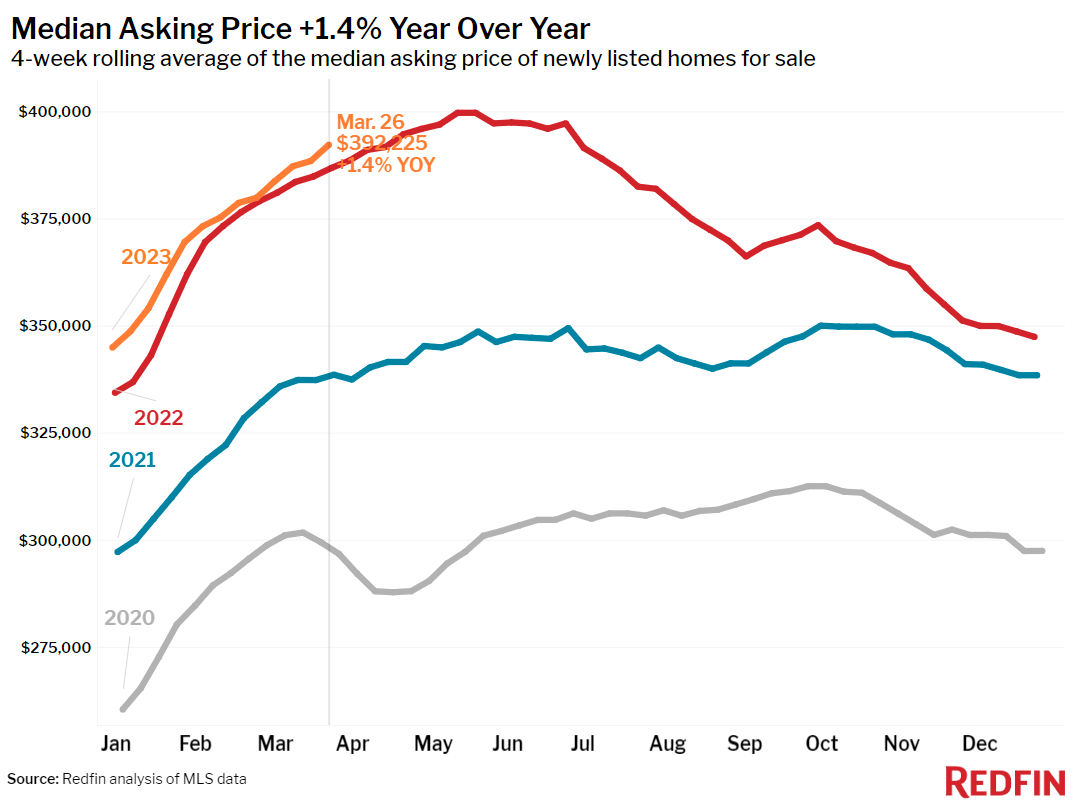
- The median asking price of newly listed homes was $392,225, up 1.4% year over year.
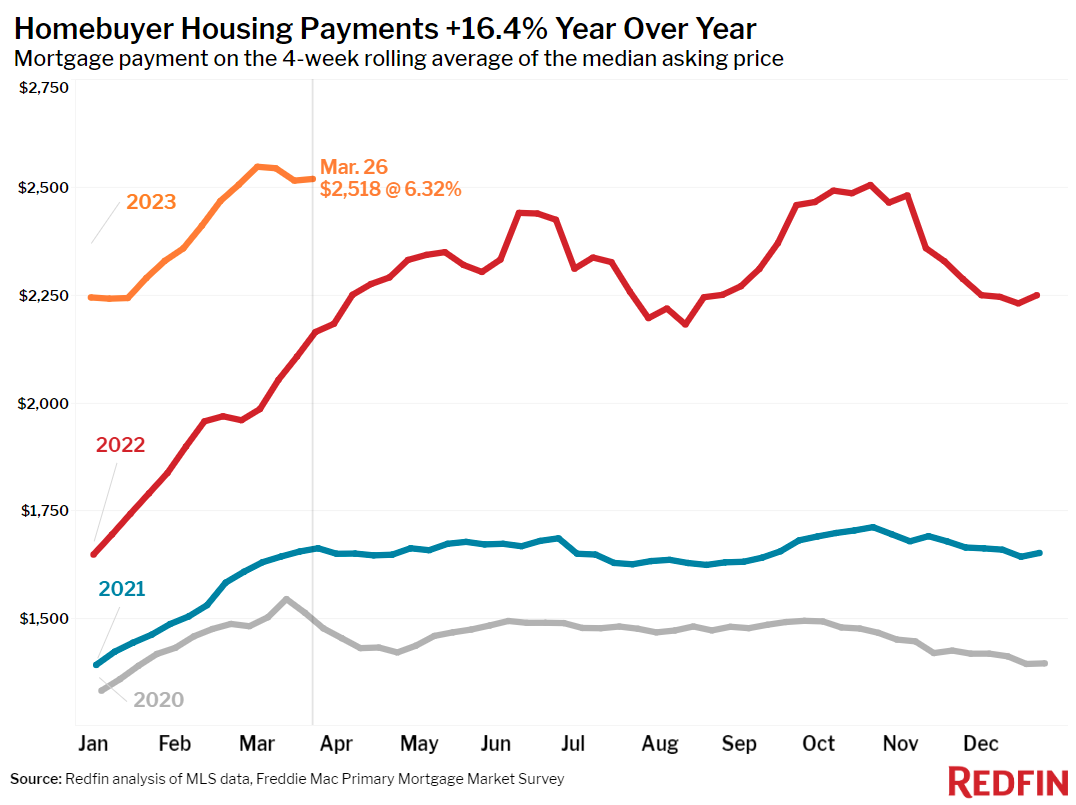
- The monthly mortgage payment on the median-asking-price home was $2,518 at a 6.32% mortgage rate, the current weekly average. Monthly mortgage payments are down slightly from the peak they reached three weeks ago, but up 16% ($354) from a year ago.
- Pending home sales were down 19.2% year over year, the biggest decline in nearly two months.
- Pending home sales fell in all 50 of the most populous U.S. metros. They fell most in Las Vegas (-52.6% YoY), Sacramento (-48.6%), San Jose (-46.4%), Oakland (-45.4%) and Seattle (-45.2%).
- New listings of homes for sale fell 21.7% year over year. New listings have been dropping by about 21% to 22% on a year-over-year basis for the last month.
- New listings declined in all 50 of the most populous U.S. metros, with the biggest declines in Sacramento (-48.8% YoY), Oakland (-44.3%), San Francisco (-41.8%), Riverside, CA (-39.7%) and San Diego, CA (-37.9%). New listings declined least in the South: Nashville, TN (-1.1% YoY) saw the smallest drop, followed by Dallas (-3.3%), Fort Worth, TX (-3.4%), Austin (-4.8%) and Houston (-9.3%).
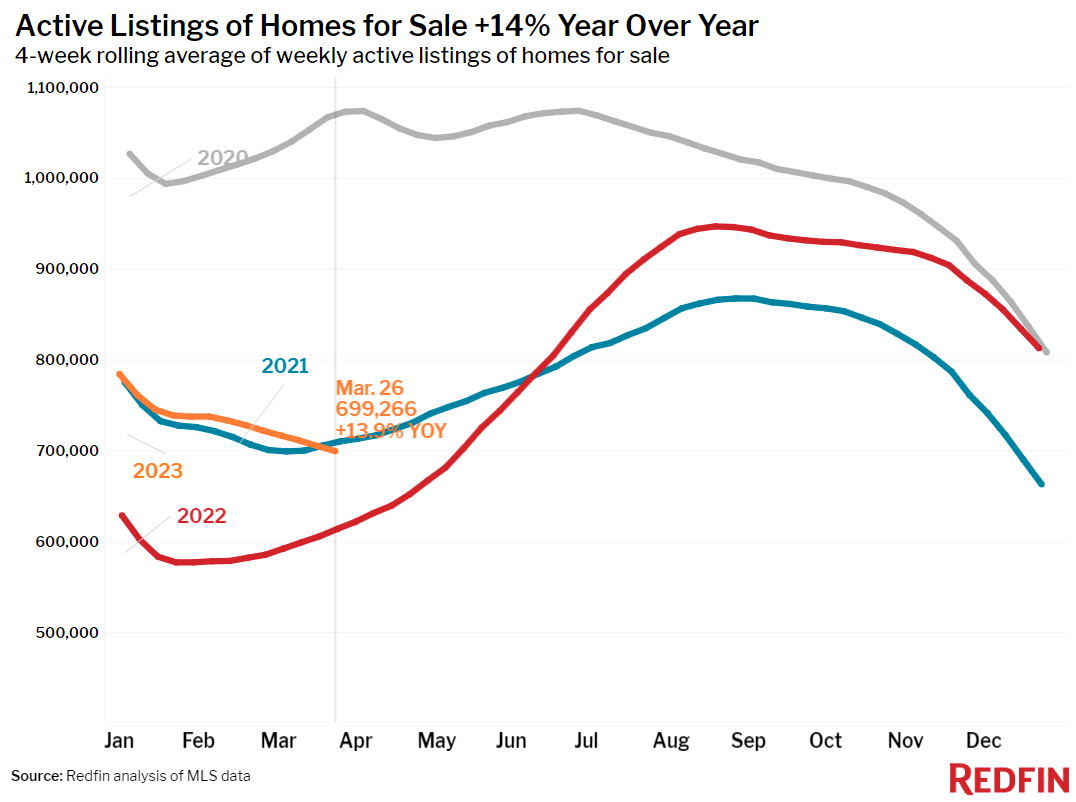
- Active listings (the number of homes listed for sale at any point during the period) were up 13.9% from a year earlier, the smallest increase in more than four months.
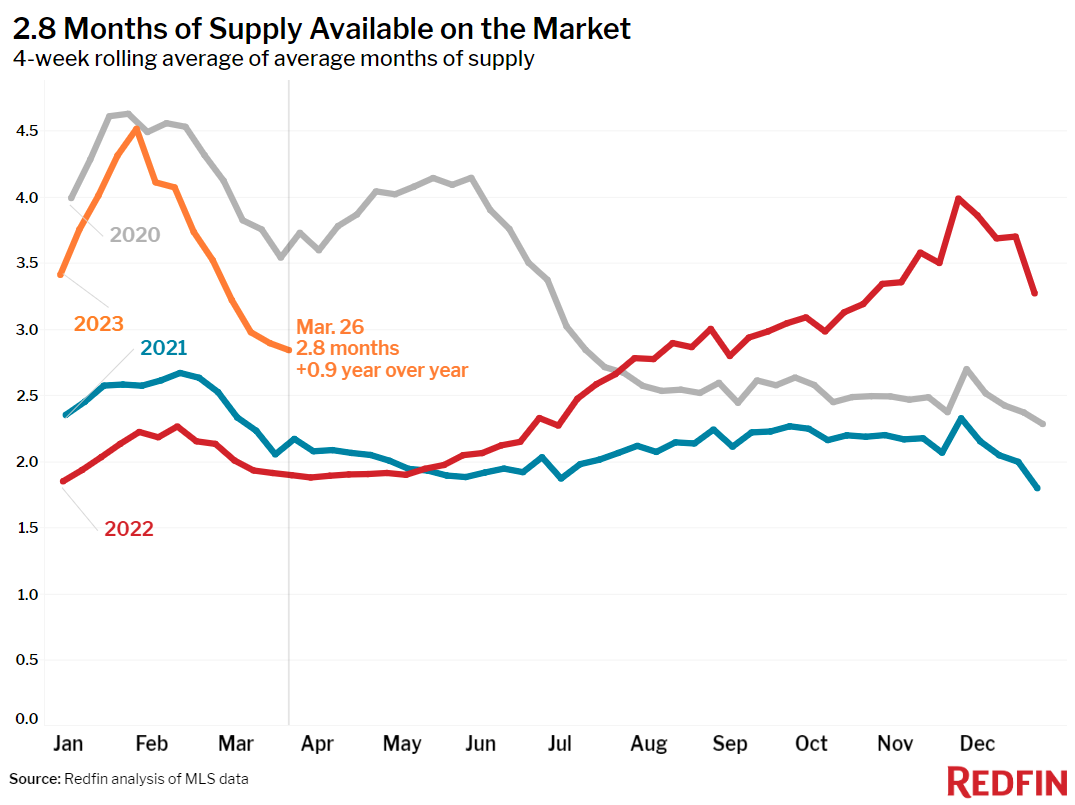
- Months of supply—a measure of the balance between supply and demand, calculated by the number of months it would take for the current inventory to sell at the current sales pace—was 2.8 months, down from 3.5 months a month earlier and up from 1.9 months a year earlier.
- 47% of homes that went under contract had an accepted offer within the first two weeks on the market, the highest level since June, but down from 53% a year earlier.
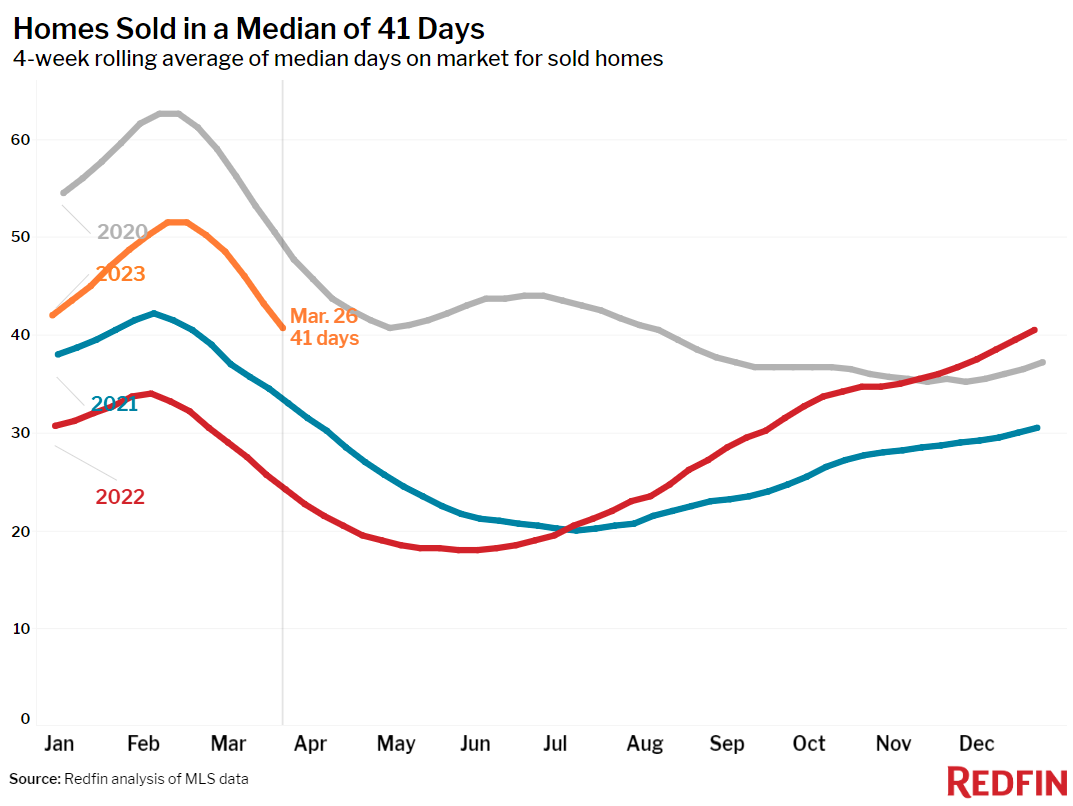
- Homes that sold were on the market for a median of 41 days. That’s up from 24 days a year earlier and the record low of 18 days set in May.
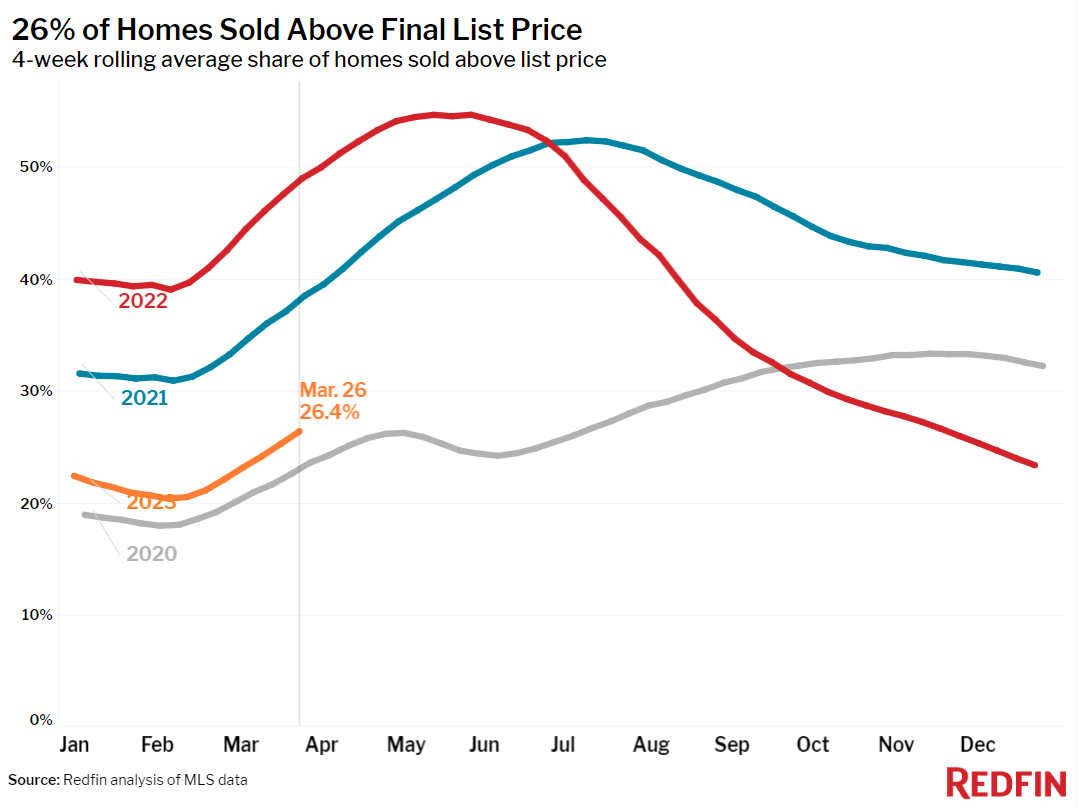
- 26% of homes sold above their final list price, the highest share in more than three months but down from 49% a year earlier.
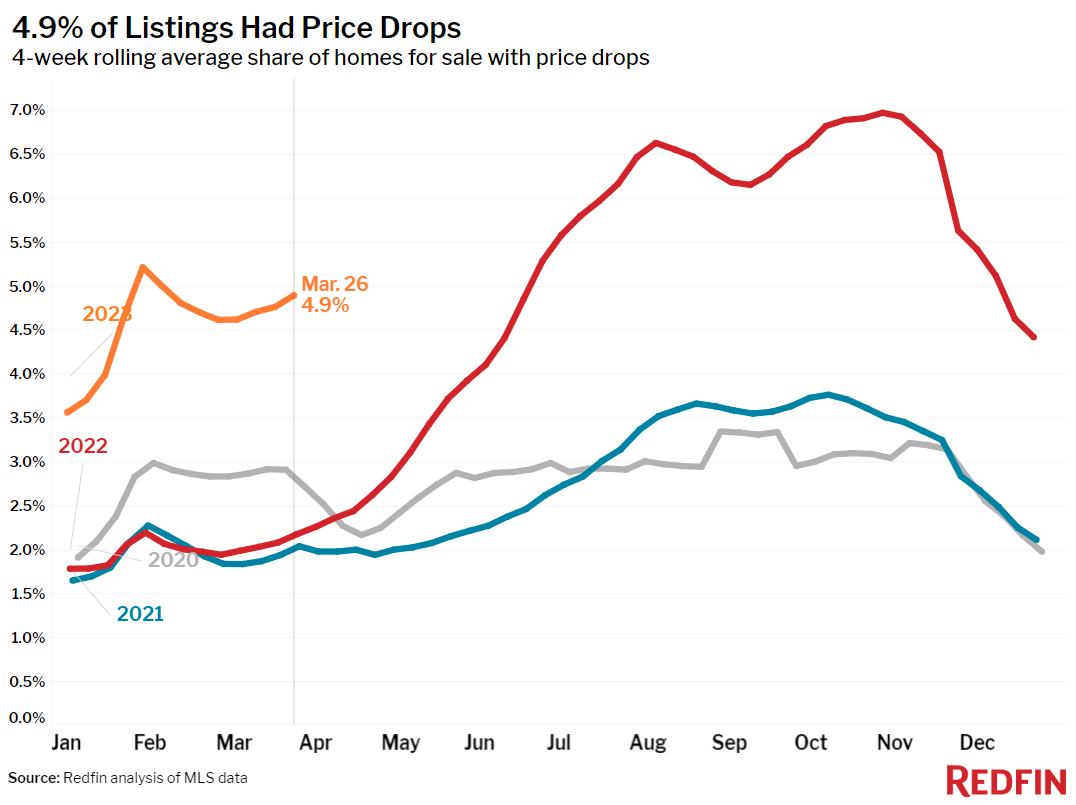
- On average, 4.9% of homes for sale each week had a price drop, up from 2.2% a year earlier.
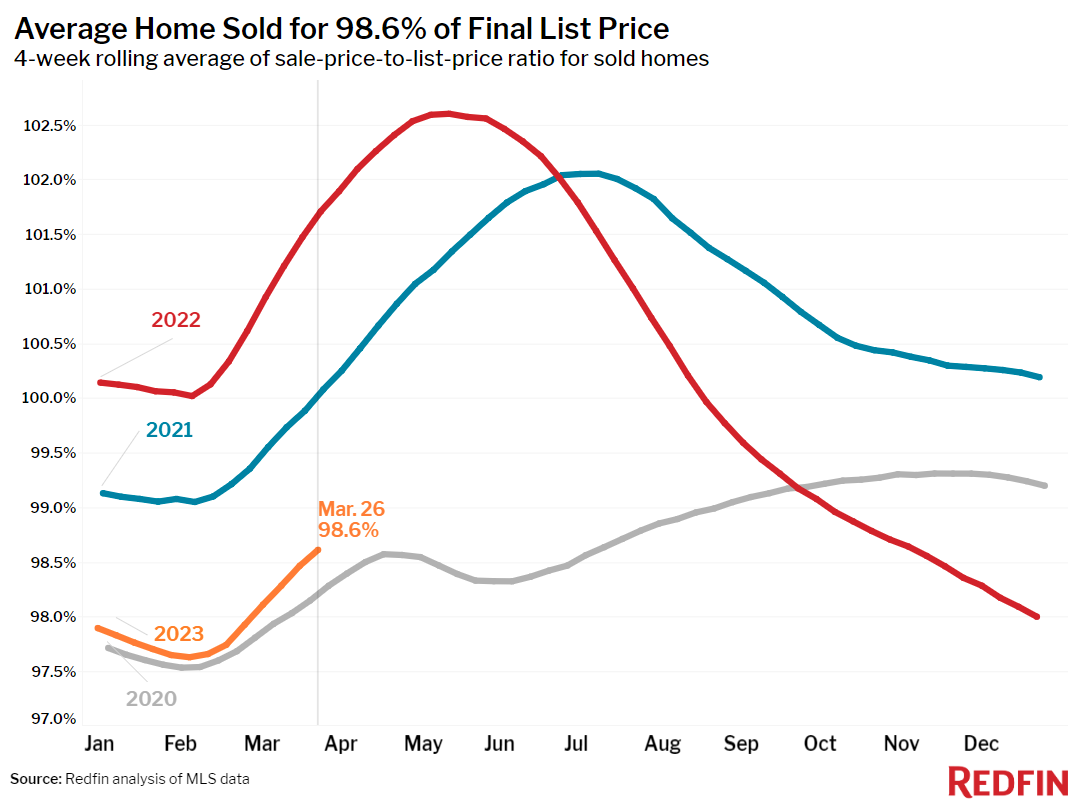
- The average sale-to-list price ratio, which measures how close homes are selling to their final asking prices, was 98.6%, the highest level in four months but down from 101.7% a year earlier.
Refer to our metrics definition page for explanations of all the metrics used in this report.