Home price growth especially strong in Mountain West and Southeastern states
By November 2022, annual home price growth is predicted to slow to 2.8%
CoreLogic, a leading global property information, analytics and data-enabled solutions provider, today released the CoreLogic Home Price Index (HPI™) and HPI Forecast™ for November 2021.
While 2021 was a record-breaking year for U.S. home price growth, for many prospective buyers the hot housing market will continue to exacerbate ongoing affordability challenges into the new year — and beyond. Though home price growth remains at historic highs, it is projected to slow over the next year. However, economic growth and inflation will most likely lead to increases in mortgage rates, which will further erode affordability.
“Over the past year, we have seen one of the most robust seller’s markets in a generation,” said Frank Martell, president and CEO of CoreLogic. “While increased interest rates may help cool down homebuying activity, we expect 2022 to be another strong year with continuing upward price growth.”
Top Takeaways:
- Nationally, home prices increased 18.1% in November 2021, compared to November 2020. On a month-over-month basis, home prices increased by 1.3% compared to October 2021.
- In November, annual appreciation of detached properties (19.4%) was 5.8 percentage points higher than that of attached properties (13.6%).
- Home price gains are projected to slow to a 2.8% increase by November 2022.
- In November, Naples, Florida, logged the highest year-over-year home price increase at 36.7%. Twin Falls, Idaho, had the second-highest ranking at a 33.3% year-over-year increase.
- At the state level, the Southeast and Mountain West regions continued to dominate the top spot, with Arizona leading the way with the strongest price growth at 28.6%. Florida ranked second place with a 25.8% growth, pushing Idaho from second to third place at 25.5%.
“Interest rates on 30-year fixed-rate mortgages averaged a record low of 2.96% during 2021, helping to keep monthly payments low in the face of record-high home prices,” said Dr. Frank Nothaft, chief economist at CoreLogic. “However, the Federal Reserve appears poised to allow interest rates to rise in 2022. Higher rates will intensify buyer affordability challenges, especially in overvalued local markets.”
The next CoreLogic HPI press release, featuring December 2021 data, will be issued on February 1, 2022, at 8 a.m. ET.


Methodology
The CoreLogic HPI™ is built on industry-leading public record, servicing and securities real-estate databases and incorporates more than 45 years of repeat-sales transactions for analyzing home price trends. Generally released on the first Tuesday of each month with an average five-week lag, the CoreLogic HPI is designed to provide an early indication of home price trends by market segment and for the “Single-Family Combined” tier, representing the most comprehensive set of properties, including all sales for single-family attached and single-family detached properties. The indices are fully revised with each release and employ techniques to signal turning points sooner. The CoreLogic HPI provides measures for multiple market segments, referred to as tiers, based on property type, price, time between sales, loan type (conforming vs. non-conforming) and distressed sales. Broad national coverage is available from the national level down to ZIP Code, including non-disclosure states.
CoreLogic HPI Forecasts™ are based on a two-stage, error-correction econometric model that combines the equilibrium home price—as a function of real disposable income per capita—with short-run fluctuations caused by market momentum, mean-reversion, and exogenous economic shocks like changes in the unemployment rate. With a 30-year forecast horizon, CoreLogic HPI Forecasts project CoreLogic HPI levels for two tiers — “Single-Family Combined” (both attached and detached) and “Single-Family Combined Excluding Distressed Sales.” As a companion to the CoreLogic HPI Forecasts, Stress-Testing Scenarios align with Comprehensive Capital Analysis and Review (CCAR) national scenarios to project five years of home prices under baseline, adverse and severely adverse scenarios at state, metropolitan areas and ZIP Code levels. The forecast accuracy represents a 95% statistical confidence interval with a +/- 2% margin of error for the index.
About Market Risk Indicator
Market Risk Indicators are a subscription-based analytics solution that provide monthly updates on the overall “health” of housing markets across the country. CoreLogic data scientists combine world-class analytics with detailed economic and housing data to help determine the likelihood of a housing bubble burst in 392 major metros and all 50 states. Market Risk Indicators is a multi-phase regression model that provides a probability score (from 1 to 100) on the likelihood of two scenarios per metro: a >10% price reduction and a ≤ 10% price reduction. The higher the score, the higher the risk of a price reduction.
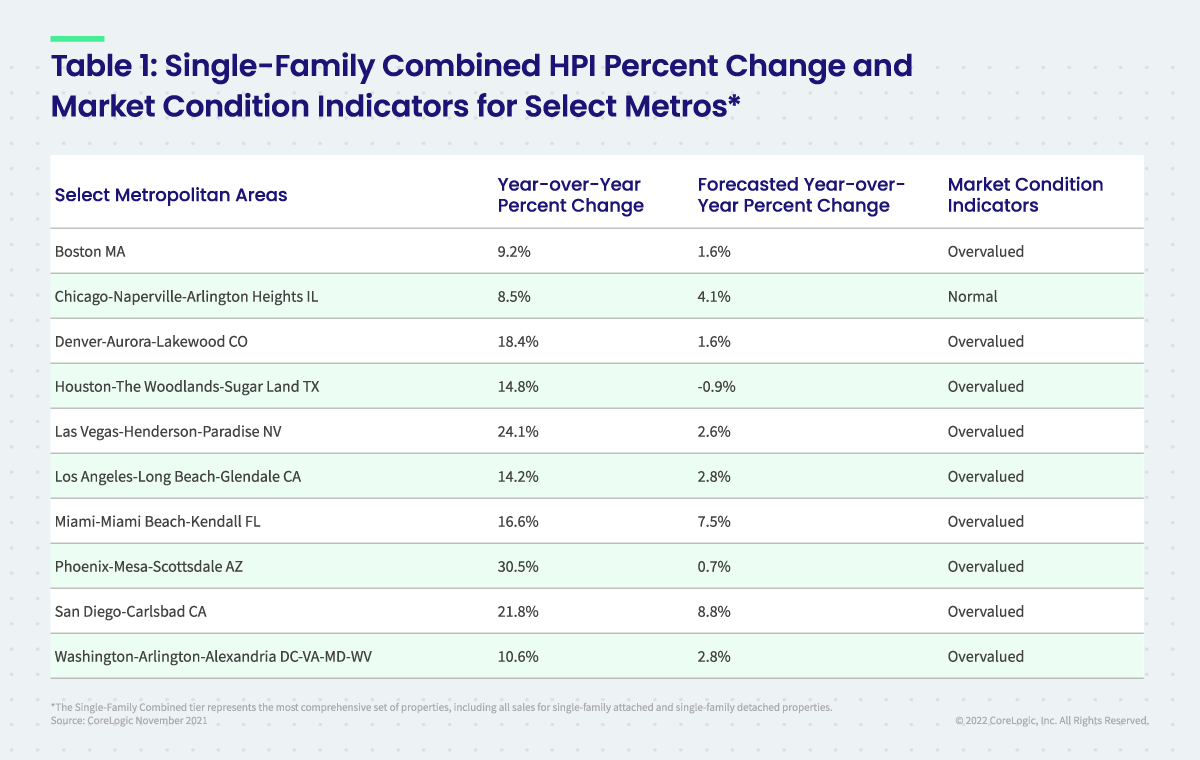
About the Market Condition Indicators
As part of the CoreLogic HPI and HPI Forecasts offerings, Market Condition Indicators are available for all metropolitan areas and identify individual markets as “overvalued”, “at value”, or “undervalued.” These indicators are derived from the long-term fundamental values, which are a function of real disposable income per capita. Markets are labeled as overvalued if the current home price indexes exceed their long-term values by greater than 10%, and undervalued where the long-term values exceed the index levels by greater than 10%.
Source: CoreLogic
The data provided are for use only by the primary recipient or the primary recipient’s publication or broadcast. This data may not be resold, republished or licensed to any other source, including publications and sources owned by the primary recipient’s parent company without prior written permission from CoreLogic. Any CoreLogic data used for publication or broadcast, in whole or in part, must be sourced as coming from CoreLogic, a data and analytics company. For use with broadcast or web content, the citation must directly accompany first reference of the data. If the data are illustrated with maps, charts, graphs or other visual elements, the CoreLogic logo must be included on screen or website. For questions, analysis or interpretation of the data, contact Robin Wachner at newsmedia@corelogic.com. Data provided may not be modified without the prior written permission of CoreLogic. Do not use the data in any unlawful manner. The data are compiled from public records, contributory databases and proprietary analytics, and its accuracy is dependent upon these sources.
About CoreLogic
CoreLogic is a leading global property information, analytics and data-enabled solutions provider. The company’s combined data from public, contributory and proprietary sources includes over 4.5 billion records spanning more than 50 years, providing detailed coverage of property, mortgages and other encumbrances, consumer credit, tenancy, location, hazard risk and related performance information. The markets CoreLogic serves include real estate and mortgage finance, insurance, capital markets, and the public sector. CoreLogic delivers value to clients through unique data, analytics, workflow technology, advisory and managed services. Clients rely on CoreLogic to help identify and manage growth opportunities, improve performance and mitigate risk. Headquartered in Irvine, Calif., CoreLogic operates in North America, Western Europe and Asia Pacific. For more information, please visit www.corelogic.com.
CORELOGIC, the CoreLogic logo, CoreLogic HPI and CoreLogic HPI Forecast are trademarks of CoreLogic, Inc. and/or its subsidiaries. All other trademarks are the property of their respective owners.
Media Contact
Robin Wachner
CoreLogic
newsmedia@corelogic.com