- While U.S. year-over-year home price growth increased for the 134th straight month in March, it continued to decelerate from the spring 2022 peak
- Ten states saw home prices decline from one year ago, most of them in the Western U.S.
CoreLogic®, a leading global property information, analytics and data-enabled solutions provider, today released the CoreLogic Home Price Index (HPI™) and HPI Forecast™ for March 2023.
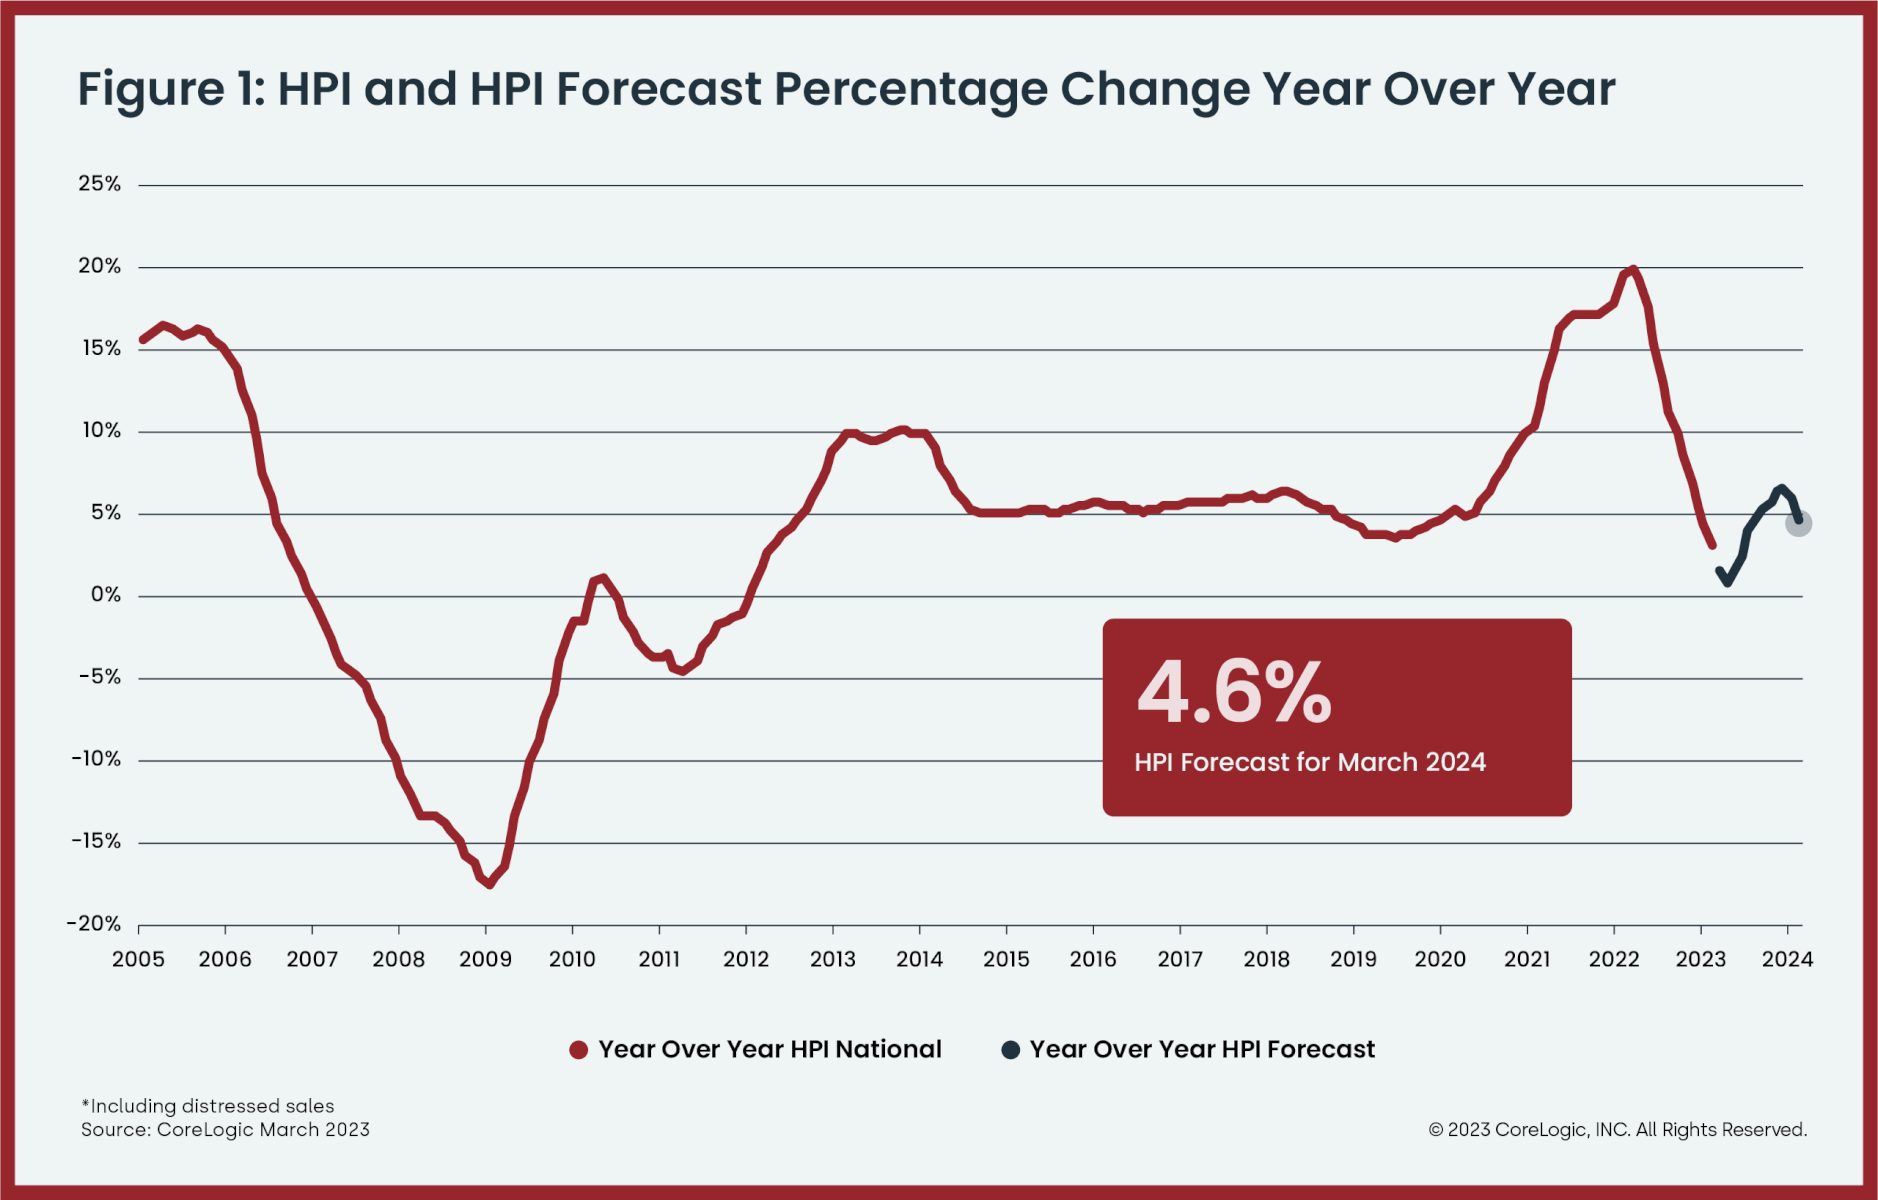
U.S. home price growth fell to 3.1% in March, the lowest rate of appreciation since the spring of 2012. While home price growth rose for the 134th consecutive month, it declined from one year earlier in 10 states, mostly those in the West, which partially reflects the region’s lack of affordability and continued inventory shortages. Also, demand for higher-priced homes is slowing compared with median-priced homes, thus pulling appreciation down in that region at a faster pace.
Some potential homebuyers remain hesitant due to inflation; slowing job gains and wage growth; a potential recession; and interest rates that are still elevated above a mortgage rate of 5.5% that would likely attract more buyers to the market. As a result of these conditions, CoreLogic projects that U.S. annual home price growth will continue to decline over the spring and early summer before picking back up later in 2023.
“While housing markets across the country continue to send mixed signals, prices in many large metros appeared to have turned the corner, with the U.S. recording a second month of consecutive monthly gains,” said Selma Hepp, chief economist at CoreLogic. “At 1.6%, the month-over-month increase was twice the average seen between 2015 and 2020.”
“The monthly rebound in home prices underscores the lack of inventory in this housing cycle,” Hepp continued. “In addition, while the lack of affordability generally weighs on home price growth, mobility resulting from remote working conditions appears to be a current driver of home prices in some areas of the country.”
Top Takeaways:
- U.S. home prices (including distressed sales) increased by 3.1% year over year in March 2023 compared with March 2022. On a month-over-month basis, home prices increased by 1.6% compared with February 2023.
- In March, the annual appreciation of attached properties (4.6%) was 2.1 percentage points higher than that of detached properties (2.5%).
- CoreLogic forecasts show annual U.S. home price gains moving to 4.6% by March 2024.
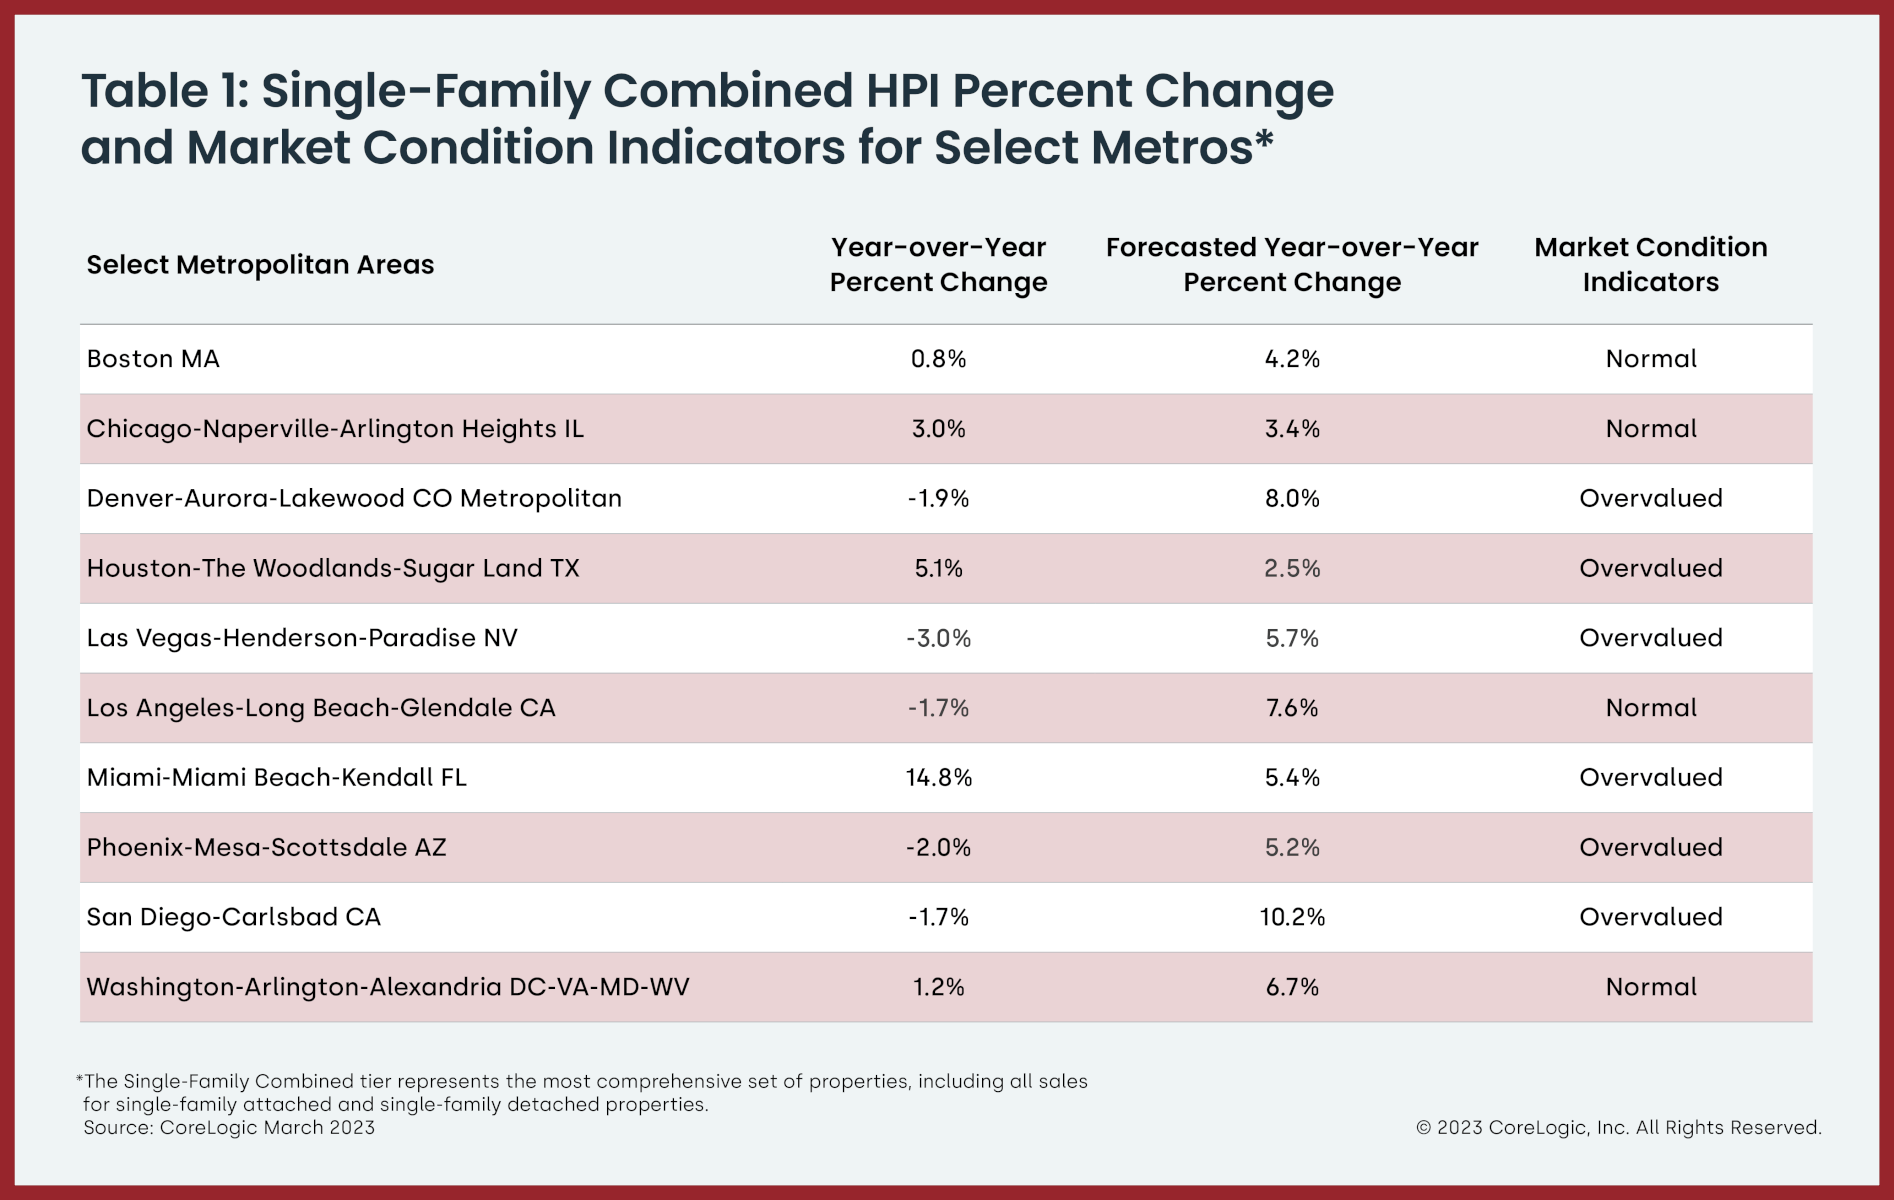
- Miami posted the highest year-over-year home price increase of the country’s 20 tracked metro areas in March, at 14.8%, while Tampa, Florida continued to rank second at 6.9%.
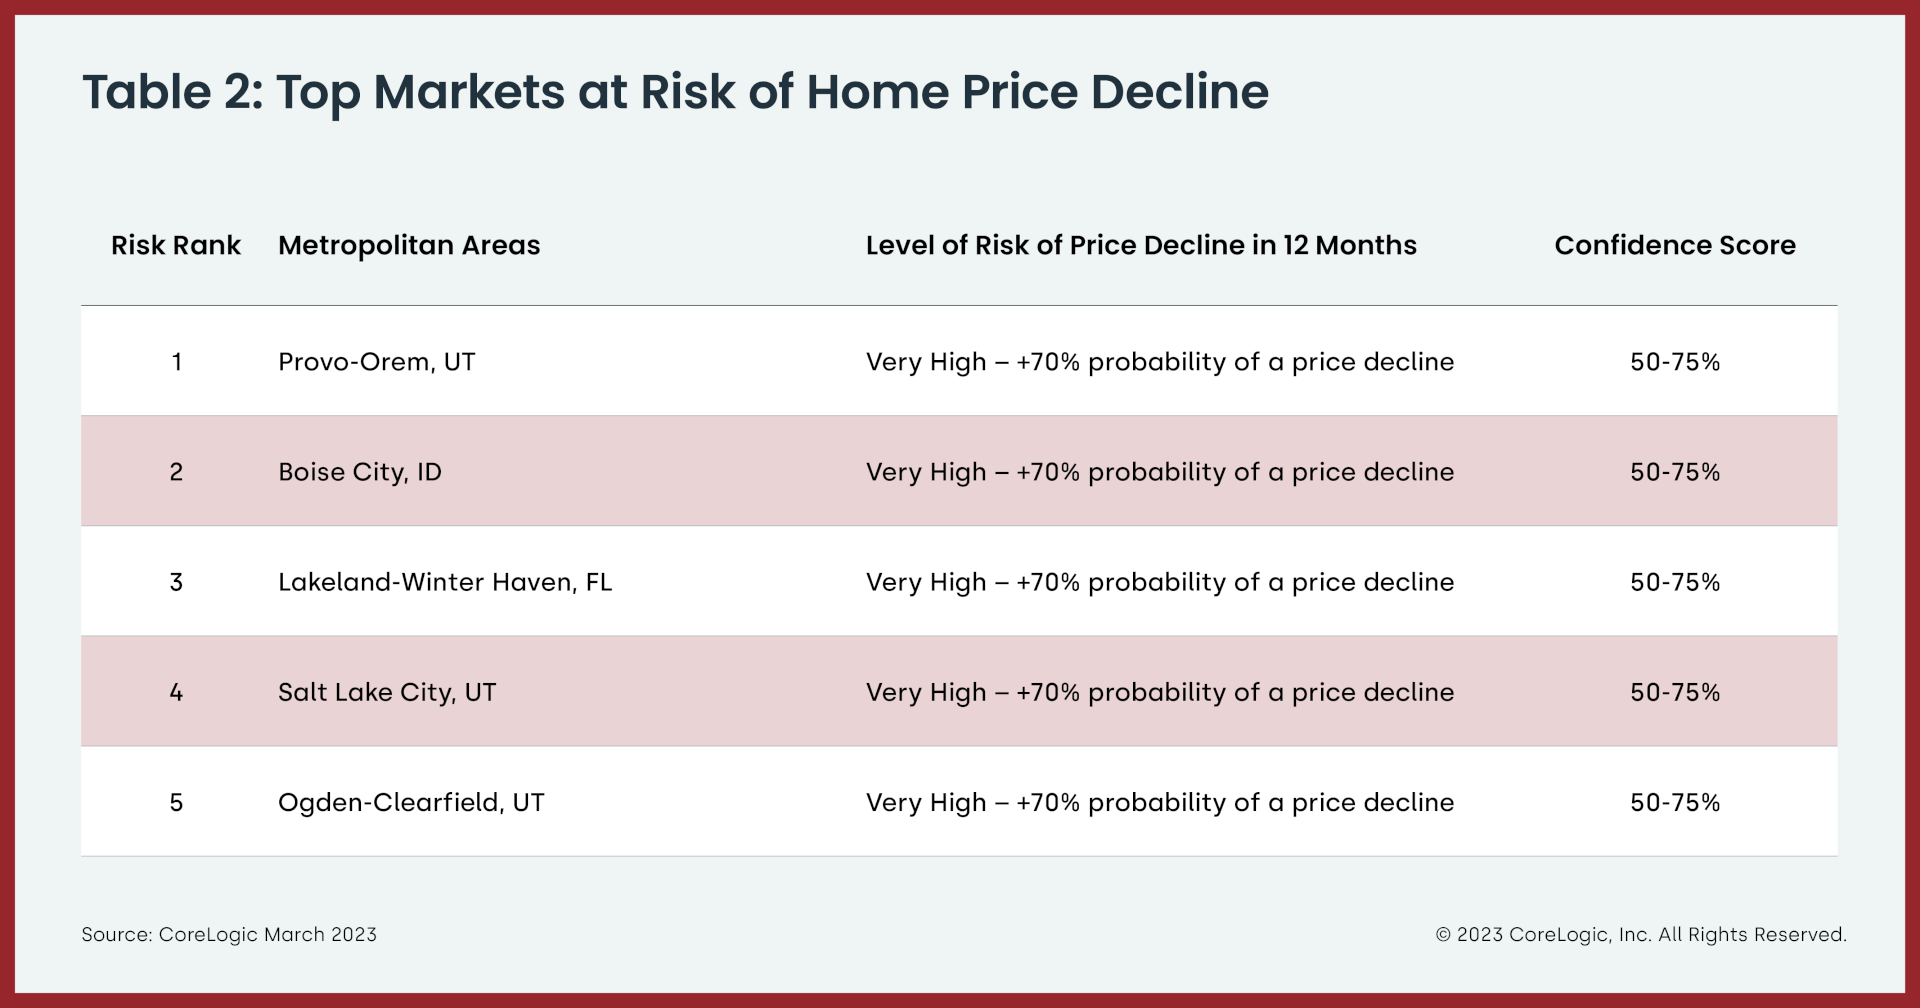
- Among states, Vermont and Indiana recorded the highest annual home price gains, 9.9% and 9.2%, respectively. Florida posted the third-highest growth, with an 8.9% year-over-year increase. Ten states recorded annual losses: Washington (-7.4%), Idaho (-3.6%), Nevada (-3.5%), Utah (-3.4%), California (-3%), Montana (-2.3%), Oregon (-2%), Colorado (-1%), Arizona (-0.9%) and New York (-0.6%).
The next CoreLogic HPI press release, featuring April 2023 data, will be issued on June 6, 2023, at 8 a.m. EST.
Methodology
The CoreLogic HPI™ is built on industry-leading public record, servicing and securities real-estate databases and incorporates more than 45 years of repeat-sales transactions for analyzing home price trends. Generally released on the first Tuesday of each month with an average five-week lag, the CoreLogic HPI is designed to provide an early indication of home price trends by market segment and for the Single-Family Combined tier, representing the most comprehensive set of properties, including all sales for single-family attached and single-family detached properties. The indices are fully revised with each release and employ techniques to signal turning points sooner. The CoreLogic HPI provides measures for multiple market segments, referred to as tiers, based on property type, price, time between sales, loan type (conforming vs. non-conforming) and distressed sales. Broad national coverage is available from the national level down to ZIP Code, including non-disclosure states.
CoreLogic HPI Forecasts™ are based on a two-stage, error-correction econometric model that combines the equilibrium home price—as a function of real disposable income per capita—with short-run fluctuations caused by market momentum, mean-reversion, and exogenous economic shocks like changes in the unemployment rate. With a 30-year forecast horizon, CoreLogic HPI Forecasts project CoreLogic HPI levels for two tiers — Single-Family Combined (both attached and detached) and Single-Family Combined Excluding Distressed Sales. As a companion to the CoreLogic HPI Forecasts, Stress-Testing Scenarios align with Comprehensive Capital Analysis and Review (CCAR) national scenarios to project five years of home prices under baseline, adverse and severely adverse scenarios at state, metropolitan areas and ZIP Code levels. The forecast accuracy represents a 95% statistical confidence interval with a +/- 2% margin of error for the index.
About Market Risk Indicators
Market Risk Indicators are a subscription-based analytics solution that provide monthly updates on the overall health of housing markets across the country. CoreLogic data scientists combine world-class analytics with detailed economic and housing data to help determine the likelihood of a housing bubble burst in 392 major metros and all 50 states. Market Risk Indicators is a multi-phase regression model that provides a probability score (from 1 to 100) on the likelihood of two scenarios per metro: a >10% price reduction and a ≤ 10% price reduction. The higher the score, the higher the risk of a price reduction.
About the Market Condition Indicators
As part of the CoreLogic HPI and HPI Forecasts offerings, Market Condition Indicators are available for all metropolitan areas and identify individual markets as overvalued, at value or undervalued. These indicators are derived from the long-term fundamental values, which are a function of real disposable income per capita. Markets are labeled as overvalued if the current home price indexes exceed their long-term values by greater than 10% and undervalued where the long-term values exceed the index levels by greater than 10%.
Source: CoreLogic
The data provided are for use only by the primary recipient or the primary recipient’s publication or broadcast. This data may not be resold, republished or licensed to any other source, including publications and sources owned by the primary recipient’s parent company without prior written permission from CoreLogic. Any CoreLogic data used for publication or broadcast, in whole or in part, must be sourced as coming from CoreLogic, a data and analytics company. For use with broadcast or web content, the citation must directly accompany first reference of the data. If the data are illustrated with maps, charts, graphs or other visual elements, the CoreLogic logo must be included on screen or website. For questions, analysis or interpretation of the data, contact Robin Wachner at newsmedia@corelogic.com. For sales inquiries, visit https://www.corelogic.com/support/sales-contact/. Data provided may not be modified without the prior written permission of CoreLogic. Do not use the data in any unlawful manner. The data are compiled from public records, contributory databases and proprietary analytics, and its accuracy is dependent upon these sources.
About CoreLogic
CoreLogic is a leading global property information, analytics and data-enabled solutions provider. The company’s combined data from public, contributory and proprietary sources includes over 4.5 billion records spanning more than 50 years, providing detailed coverage of property, mortgages and other encumbrances, consumer credit, tenancy, location, hazard risk and related performance information. The markets CoreLogic serves include real estate and mortgage finance, insurance, capital markets, and the public sector. CoreLogic delivers value to clients through unique data, analytics, workflow technology, advisory and managed services. Clients rely on CoreLogic to help identify and manage growth opportunities, improve performance and mitigate risk. Headquartered in Irvine, Calif., CoreLogic operates in North America, Western Europe and Asia Pacific. For more information, please visit www.corelogic.com.
CORELOGIC, the CoreLogic logo, CoreLogic HPI and CoreLogic HPI Forecast are trademarks of CoreLogic, Inc. and/or its subsidiaries. All other trademarks are the property of their respective owners.
Media Contact
Robin Wachner
CoreLogic
newsmedia@corelogic.com